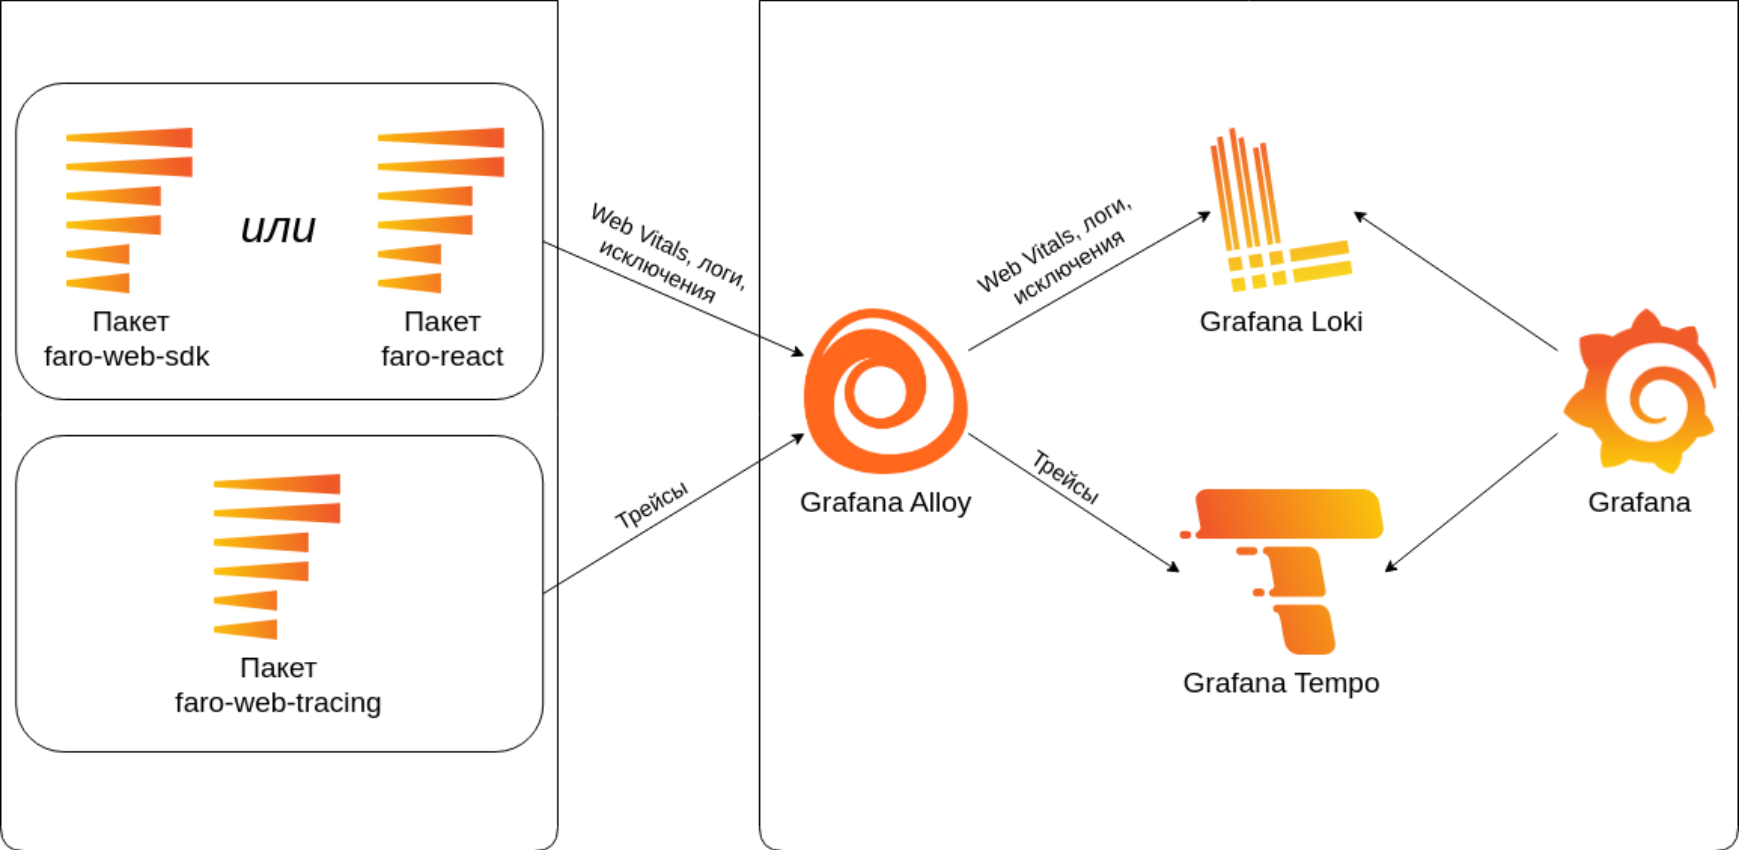
Grafana Alloy
Alloy is more than just observability signals like metrics, logs, and traces. It provides many features that help you quickly find and process your data in complex environments. Some of these features include custom components, GitOps compatibility, clustering support, security, and debugging utilities. Refer to the Alloy Introduction for more information on these and other key features.
[
github.com
https://github.com/Attracs/hetzner-digital-devops-services/blob/main/grafana-faro%20/docker-compose.yaml
](https://github.com/Attracs/hetzner-digital-devops-services/blob/main/grafana-faro%20/docker-compose.yaml)
We need to change AGENT_KEY_APP_RECEIVER=api_key in .env file. This Api key will programers to.
Grafana Agent (EoL 01.11.2025)
Note: Grafana Alloy supersedes Grafana Agent. Grafana Agent entered a long-term support phase on April 9, 2024, and will reach its end-of-life on November 1, 2025
Grafana Agent is an OpenTelemetry Collector distribution with configuration inspired by Terraform. It is designed to be flexible, performant, and compatible with multiple ecosystems such as Prometheus and OpenTelemetry.
Before you begin
- Set up a Grafana Agent instance. For more information, refer to Set up Grafana Agent.
Grafana Agent is an OpenTelemetry Collector distribution with configuration inspired by Terraform. It is designed to be flexible, performant, and compatible with multiple ecosystems such as Prometheus and OpenTelemetry.
Grafana Agent can collect, transform, and send data to: * The Prometheus ecosystem * The OpenTelemetry ecosystem * The Grafana open source ecosystem (Loki, Grafana, Tempo, Mimir, Pyroscope)
Getting started
- Choose a variant of Grafana Agent to run.
- Refer to the documentation for the variant to use:
Static mode
Static mode is the original mode of Grafana Agent. Static mode is composed of different subsystems:
* The metrics subsystem wraps around Prometheus for collecting Prometheus metrics and forwarding them over the Prometheus remote_write protocol.
* The logs subsystem wraps around Grafana Promtail for collecting logs and forwarding them to Grafana Loki.
* * Grafana Agent is an OpenTelemetry Collector distribution with configuration inspired by Terraform. It is designed to be flexible, performant, and compatible with multiple ecosystems such as Prometheus and OpenTelemetry.
* * Grafana Agent can collect, transform, and send data to:
* The Prometheus ecosystem
* The OpenTelemetry ecosysteThe traces subsystem wraps around OpenTelemetry Collector for collecting traces and forwarding them to Grafana Tempo or any OpenTelemetry-compatible endpoint.
Static mode is configured with a YAML file.
Run Grafana Agent in static mode in a Docker container
Before you begin
- Create and save a Grafana
-
- Grafana Agent is an OpenTelemetry Collector distribution with configuration inspired by Terraform. It is designed to be flexible, performant, and compatible with multiple ecosystems such as Prometheus and OpenTelemetry.
-
- Grafana Agent can collect, transform, and send data to:
- The Prometheus ecosystem
- The OpenTelemetry ecosysteAgent YAML configuration file on your computer.
agent.yml
metrics:
  wal_directory: /tmp/wal
  global:
    remote_write:
      - url: http://localhost:9009/api/prom/push

integrations:
  agent:
    enabled: true
or Full config example Here is an example full config file, using integrations, Prometheus, Loki, and Tempo:
server:
  log_level: info

metrics:
  global:
    scrape_interval: 1m
    remote_write:
      - url: http://localhost:9009/api/prom/push
  configs:
    - name: default
      scrape_configs:
        - job_name: agent
          static_configs:
            - targets: ['127.0.0.1:12345']

logs:
  configs:
  - name: default
    positions:
      filename: /tmp/positions.yaml
    scrape_configs:
      - job_name: varlogs
        static_configs:
          - targets: [localhost]
            labels:
              job: varlogs
              __path__: /var/log/*log
    clients:
      - url: http://localhost:3100/loki/api/v1/push

traces:
  configs:
  - name: default
    receivers:
      jaeger:
        protocols:
          grpc: # listens on the default jaeger grpc port: 14250
    remote_write:
      - endpoint: localhost:55680
        insecure: true  # only add this if TLS is not required
    batch:
      timeout: 5s
      send_batch_size: 100

integrations:
  node_exporter:
    enabled: true
To set up Grafana Tempo to send traces to Grafana Agent, you need to configure Tempo to export traces in Jaeger Thrift format and then set up Grafana Agent to receive traces from Tempo. Below are the steps to achieve this:

1. **Configure Grafana Tempo to Export Traces in Jaeger Format**:

   You need to configure Tempo to export traces in the Jaeger Thrift format. You can achieve this by configuring Tempo's `traces.jaeger.grpc` exporter. Here's an example configuration snippet for Tempo's `tempo.yaml`:

   ```yaml
   jaeger:
     grpc:
       endpoint: "grafana-agent.example.com:14250"
   ```

   Replace `"grafana-agent.example.com:14250"` with the hostname and port where Grafana Agent is listening for traces.

2. **Set Up Grafana Agent to Receive Traces**:

   Grafana Agent can receive traces in Jaeger Thrift format and forward them to other backends, such as Thanos or Loki. Here's an example of how you can set up Grafana Agent to receive traces:

   ```yaml
   receivers:
     jaeger:
       protocols:
         thrift_binary:
           endpoint: 0.0.0.0:14250

   exporters:
     otlp/loki:
       address: loki:3100

   service:
     pipelines:
       traces:
         receivers: [jaeger]
         exporters: [otlp/loki]
   ```

   In this example, Grafana Agent is configured to receive traces using the Jaeger Thrift protocol on port `14250` and export them to Loki. Adjust the configuration as needed based on your setup.

3. **Deploy and Start Grafana Agent and Tempo**:

   Deploy Grafana Agent and Tempo in your Kubernetes cluster or on your server. Ensure that both services are running and accessible to each other.

4. **Verify Tracing**:

   Once Grafana Agent and Tempo are set up and running, you can verify that tracing is working by sending requests to your application and observing traces in Grafana Tempo and Grafana Agent.

By following these steps, you can configure Grafana Tempo to send traces to Grafana Agent for further processing or storage. Adjust the configurations as needed based on your specific requirements and deployment environment.