Grafana migration from old Hetzner to Hetzner Cloud
0. Grafana to hetzner steps
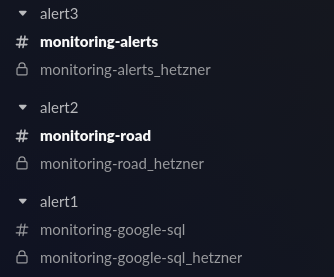
Replika of the old-grafana. - done Create duplicate channels for alerts. -done
follow alerts in grafana, if the alerts form old grafana are == to the new grafana hetzner. Remove old alert and switch _hetzner alert to the normal channel.
1. folders and their panels with dashboards
-
General
- Espoo statistics (dashboards 0 or error need check)
- Espoo customers with tokens
- No data need to check.
- Error: Datasource Attracs Google Cloud PostgreSQL - tms_booking was not found
- Kulkukeskus manage users with tokens (updated hourly)
- Data source: MySQL
SELECTupdated AS "time",espoo_users_login_countcolFROM grafana.espoo_users_login_countORDER BY updated
- Data source: MySQL
- Kulkukeskus rivers with tokens
- espoo_drivers_with_token
- espoo_drivers_total
- Espoo customers with tokens
- PostgreSQL Database
- General Counters, CPU, Memory and File Descriptor Stats (9 panels)
- Version
- Start Time
- Average CPU Usage
- Current fetch data
- Current insert data
- Average Memory Usage
- Current update data
- Max Connections
- Open File Descritors
- Settings (7)
- Shared Buffers
- Effective Cache
- Maintenance Work Mem
- Work Mem
- Max WAL Size
- Random Page Cost
- Max Worker Processes
- Database Stats (18 panels)
- Active sessions
- Transactions
- pg_stat_database_tup_updated
- pg_stat_database_tup_fetched
- pg_stat_database_tup_inserted
- Lock tables
- pg_stat_database_tup_returned
- Idle sessions
- pg_stat_database_tup_deleted
- Cache Hit Rate
- Buffers (bgwriter)
- Conflicts/Deadlocks
- Temp File (Bytes)
- Checkpoint Stats
- Database size (Bytes))
- Top 6 Database size increase in 7 days (b)
- Top6 Database size increase in 1 day
- Top6 Database size increase in 1 day (b) alert
- General Counters, CPU, Memory and File Descriptor Stats (9 panels)
- PostGressSQL
- Active connections
- datname; username; state; count_user
- Active connections
- Espoo statistics (dashboards 0 or error need check)
-
Ahola-AO
- Log digest - clients
- LOG-ENTRY: OCLPERF DAILY
- LOG-ENTRY: EXCEPTIONS DAILY
- LOG-ENTRY: OSS: BD Optimistic Locking Fail event DAILY
- LOG ENTRY: OSS: DB Optimistic Locking Fail event
- LOG-ENTRY: EXCEPTION
- LOG-ENTRY: OCLPERF
- LOG-ENTRIES FOR USER LOGS: beginArrivalAsLDT grouped by server
- no data
- LOG-ENTRIES FOR USERS LOGS: beginArrivalsAsLDT grouped by ID
- no data
- LOG-ENTRIES FOR USER LOGS: User Logger off
- Log digest - clients
-
applications
-
DriversAppServer
- Sessions
- Total responses by HTTP code per min
-
TMS (10 sections)
-
HTTP API (3 panels)
- HTTP API
- stable | Responce latency
- stable | Response latency (potentiall big latencies)
-
tms-drivers (3 panels)
-
Vehicles which have update location within time period
- last_10sec
- last_60sec
- last_10min
- last_1h
- last_24
- total
- Drivers App Versions
- stable | Active WebSocket Clients
-
-
tms-planner (2 panels)
- Planner offer automation
- Combination suggester
-
Database (3 panels)
- PostgreSQL Connections
- Idle sessions
- Deadlock (alert on)
alert message: TMS deadlock detected, please check why
-
RPC / Pubsub (4 panels)
- stable | RPC calls
- PubSub
- ExecuteBackoffs (alert on)
- no data need check!
alert message : ExecuteBackOffs logged, please check!
- Oldest unacked message (alert on)
alert message: Oldest unacked message age is over limit, please check.
-
WebSicket (3 panels)
- stable | WebSocket Events
- stable | Active WebSocket Clients
- stable | Auth
-
Server stats (6 panels)
- CPU Usage
- goroutines
- Network Traffic
- Process memory usage
- Server Status:
- tms-planner
- tms-booking
- tms-brivers
- tms-fleet
- Server free memory
-
App versions (1 panel)
- Service Versions
- build date; deploy; hash; instance; name; type; version
- Service Versions
-
PubSub Detailed (10 panels)
- tms-backend-3.tms-booking (alert on)
- alert message when triggered: "Acked messages on pubsub subscriptions is suspiciously low, please check".
- tms-backend-4.tms-booking (alert on)
- tms-backend-3.tms-drivers (alert on)
- tms-backend-4.tms-drivers (alert on)
- tms-backend-3.tms-feedback (alert on)
- tms-backend-4-feedback (alert on)
- tms-backend-3.tms-fleet
- tms-backend-4.tms-fleet
- tms-backend-3.tms-planner
- tms-backend-4.tms-planner
- tms-backend-3.tms-booking (alert on)
-
Errors (3 panels)
- TMS Errors
- TMS Errors shortened
- TMS Errors shortened, last 7 days
-
-
Vehcodataservice
- Hits per endpoint per minute
- Average response times
- RPC calls
- PubSub
- PubSub Stable for Alarm (alert on)
- alert message: Vehco.stable.event pubsub channel has unusually low message count. Please check if we're receiving Vehcodata with vehcodataservice.
- Total responses by HTTP code per min (HAproxy is not aware of traffic duplication to nightly)
- Current total of incoming / outgoing bytes per min (HAproxy is not aware of traffic duplication to nightly)
- Number of transactions
- no data need to check
- I change this and it work
- Service was empty I select Monitoring and Metric name was empty select Time series count.
- PostgreSQL Connections
No dataneed to check
- PostgreSQL Slow Queries - vehcodataservice
No dataneed to check
-
aholapartnerportal
- Sessions
- no data need check
- Aholapartnerportal http requests per code
- no data need check
- Sessions
-
go metrics (on top we cam select deploy: nightly / stable and services: tms-fleet; tms-booking; tms-planner; tms-drivers
- GC spent time
- Next GC
- Memory in stack
- Total Used Memory
- Number of Live Objects
- Rate of Objects Allocated
- Rate of a Pointer Dereferences
- Gorutines
- Memory in off-Heap
- Memory in Heap
- Rates of Allocation
- GC duration quantile
-
tms_alerts
here is metric for all tms services
- goroutines (alert on)
-
tower.attracs.com NEED TO CHECK no data.
- Tickets
- WebSocket
- Attracs Online API Vehicles
- Attracs Online API
- Online API Errors
- PubSub
- Nightly | response time
- Nightly requests
-
-
Camel
- Camel Additionals no data need check
- Cloud Storage Received byte
- Cloud Storage Total bytes (daily)
- FTP Logins
- FTP Uploads
- SFTP Logins
- SFTP Uploads
- Pubsub
- Pubsub - inacked messages
- Camel Additionals no data need check
-
Core
-
stable
nightly
- stats
- stats by application
- response time
- service Details
-
Stable no data
nightly
- WebSocket
- PubSub
- nightly | response time
- nightly | requests
- nightly | calls
- Service Details
-
Sable no data
nightly
- calls
- update
- ignored
- no data
- Service Details
-
stable no data
nightly
- response time
- requests
- calls
- Service Details
-
stable no data
nightly
- database
- calls
- Service Details
-
stable no data need check
nightly
- response time
- requests
- calls
- Service Details
-
-
External-AO
-
Cbookings - Azure / IIS No data need check
- Cbooking latency
- Cbooking latency totals for .*sync
- Cbooking latency totals for .*departments.*sync
- Cbooking latency totals for .*organizations.*sync
- Cbooking latency totals for .*orders.*
- Cbooking latency totalCbooking latency total without .*sync
- Cbooking hit counts
-
External AO services
- Backendsrv-1-Cramo Production
- Backendsrv-0 - Peura Production
- BackendSRV-1 - Thermotrans Production
- BackendSrv-0 Roadari Production
- BackendSrv-1- OSTP Production
- BackendSrv-0 (alert on)
- BACKENDSRV-0 Service is down
- BackendSrv-1 (alert on)
- BACKENDSRV-1 Service is down
-
Log Digest - clients
- Log-ENTRY: Optimistic Locking Daily
- Log-ENTRY: Optimistic Locking (alert on)
- no data
- alert message: External AO might be experiencing OSS issue, please check
- Log-ENTRY: Exception (alert on)
- no data
- alert message: EXCEPTION's logged are over limit!
- Log-ENTRY: OCLPERF (log on)
- no data
- alert message: Logged OCLPERFs are over limit
- Log-ENTRIES For Users Logs
-
Log Digest - servers
- Log-Entry: Exception (alert on)
- alert message: EXCEPTIONs logged are over limit!
- LOG-ENTRY: OCLPERF (alert on)
- alert message: Logged OCLPERFs are over limit
- Log-Entry: Warning
- Log-Entry: INFO
- Log-Entry:AMCupdated by regnumber
- Log-Entry:AMCupdated by logname
- Log-Entry: Exception (alert on)
-
Logging stats
- Log bytes ingested
- Exported log bytes per sink
- Exported log bytes per sink daily
-
RDP
- Certificate expiration for online2.attracs.com (alert on)
- Certificate expiration for cramo.attracs.com (alert on)
- Request latency (alert on)
- alert message: Request latency alert
- RDSGATEWAY - Firewall - Allowed TCP connections per ip in 1 day
- RDSGATEWAY - Firwall - Allower TCP connections per ip (health checks excluded) (alert on)
- alert message: Connection counts per ip over limit.
- RDSGATEWAY - Microsoft-Windows-TerminalServices-Gateway/Operational
- RDSGATEWAY - Event 4625 - Fail reason (alert on)
- alert message: RDSGATEWAY - Event 4625 - Fail reason alert
- RDSGATEWAY - Event 4625 - Username
- RDSBROKER - Microsoft-Windows-TerminalServices-SessionBroker/Operational EVENT 801 Successfully processed the connection
- RDSBROKER - Microsoft-Windows-TerminalServices-SessionBroker/Operational EVENT 801 Successfully processed the connection
-
Services
- BACKENDSRV-1 - cramo PRODUCTION
- BACKENDSRV-1 - roadari PRODUCTION
- no data
- BACKENDSRV-1 - peura PRODUCTION
- no data
- BACKENDSRV-1 - ssab PRODUCTION
- no data
- BACKENDSRV-1 - Thermotrans PRODUCTION
- BACKENDSRV-1 - ostp PRODUCTION
- BACKENDSRV-0 - roadari PRODUCTION
- BACKENDSRV-0 - ostp PRODUCTION
- no data
- BACKEND-0- cramo PRODUCTION
- no data
- BACKENDSRV-0 - peura PRODUCTION
- BACKENDSRV-0 - ssab PRODUCTION
- no data
- BACKENDSRV-0 (alert on)
- alert message:BACKENDSRV-0 Service is down
- BACKENDSRV-1 (alert on)
- alert message: BACKENDSRV-1 Service is down
-
Windows Hosts (select server: ip)
-
ALL HOSTS CPU USAGE FOR ALARMS
- CPU load (alert on) potential error
- Failed to load resource: the server responded with a status of 405 () prometheus
- alert message: CPU load is over limit, please check!
- CPU load (alert on) potential error
-
$Selected server ip
- CPU load
- system_threads
- System exception duspatches
- Memory
- Network
- Hard drive load
- Hard disk free space
- Services by state
-
-
-
General Alerting
- 404
-
Google Cloud Monitoring
-
API stats
- Consumed API - request count per service
- Consumed API - request count per service
- Consumed API - request per credential
- Consumed API - request count per response code
-
Backups
- Backup sorage usage (alert on)
- alert message: attracs-backups -project storage space has increased over set limit, please check
- CloudSQL uptime
- no date
- message alert:
- Testing of DB restore to test SQL instace has failed. This means after sql export has been made and import has been done to separate sql instance, the query that has been used for testing that database works and data is new has failed. This can due one of these issues:
- 1) backup has failed
- 2) import has failed
- 3) sql query that is used to verify db is incorrect
- Number of objects in attracs-sql-backups bucket
- Database restore test results (alert on)
- no data
- Backup sorage usage (alert on)
-
BigQuery
- Project for select:
- adi-audit-logs
- attracs-paijatsote-stable
- attracs-atspecial-stable
- adi-camel-additionals-nightly
- pg-databases-stable
- pg-databases-nightly
- attracs-devops
- Attracs-backups
- attracs-kulkukeskus
- attracs-ahola
- attracs-powdertrans
- attracs-logistics
- attracs-billing
- Attracs Nightly Services
- Attracs Services
- Panels:
- Query Execution Times
- Stored bytes for dataset None
- Uploaded rows for dataset None
- Query stats for project attracs-ahola per principalEmail and IP
- Job stats for project attracs-ahola per principalEmail and IP
- Project for select:
-
ClamAV
- ClamAV scans
- no data
- alert message: ClamAV infected files value is bigger than 0, please check!
- ClamAV scans
-
Cloud PubSub - Attracs Services (this folder need to be check\ optimization to much dashboards in one folder.
- Publish requests (PROJECT)
- Publish message size (project)
- Publish message operations (project)
- Topic byte cost, topic:All
- Topic updates, topic: All
- Topic updates, topic: All, grouped by operation type and response
- Ack latency, subscription: All
- Ack message count subscription: All
- Backlog size, subscription: All
- Subscription byte cost, subscription: All
- Subscription config updates: subscription: All
- Expired ack deadlines count: subscription: All
- Mod ack deadline message count: subscription: All
- ModifyAckDeadline message operations: subscription: all
- ModifAckDeadline requests: subscription:All
- Unacked messages: subscription: all
- Oldest unacked message age, subscription: all
- Acknowledge message operations, subscription: All
- Acknowledge message requests, subscription: All
- Sent message count, subscription: All
- Streamingpull Acknowledge requests, subscription:All
- Steamingpull message operations, subscription: All
- Streamingpull ModifyAckDeadline requests, subscription: All
- Streamingpull responses, subscription: All
- StreamingPull responses, subscription:All, grouped by result
-
Cloud PubSub - TMS
- Send message count (TMS-SERVER)
- Unacked message (TMS-server)
-
Totals (7 panels)
- Sent Message count (TMS-SERVER)
- Unacked messages (TMS-SERVER)
- Publish requests (PROJECT)
- Publish message size (project)
- Publish message operations (project)
- Backlog Size (TMS-SERVER)
- ModifyAckDeadline requests (TMS-SERVER)
- Topic byte cost, topic: ALL
- Topic updates, topic: all
-
Subscriptions (21 panels)
- Topic updates, topic: $Topic, grouped by operation type and response
- Ack latency, subscription: All
- Ack message count subscription: All
- Backlog size, subscription:All
- Subscription byte cost, subscription: All
- Subscription config updates: subscription: All
- Expired ack deadlines count: subscription: All
- Mod ack deadline
-
CloudSQL - MySQL
- CloudSQL - Postgres - Connection Details
- CloudSQL - postgres - Top Queries
2. Alerts
-
-
Ahola-AO alert
- Set name
- Rule name: alert
- query and alert condition
- project: attracs-road-logging
- Service: loging
- Metric name: logging.google.com/user/aholaao_client_error_optimistic
- Alert evaluation behavior
- Folder: Ahola-AO
- Evaluation group: alert
- for: 1m
- Add details for your rule
- Alert ID:
- Dashboard UID:
- message:
- Notification
- Labels:
- alertname = alert
- rule_uid = jLb6vDG4z
- Labels:
- Set name
-
Ahola-AO LOG-ENTRIES FOR USER LOGS: beginArrivalAsLDT grouped by ID alert
- Dashboard UID :
- Panel ID :
- message
- Labels :
-
applications Deadlocks alert
- applications ExecuteBackoffs alert
- applications goroutines alert
- applications Oldest unacked message age, subscription:$Subscription alert
- applications PubSub alert
- applications tms-backend-3.tms-booking alert
- applications tms-backend-3.tms-drivers alert
- applications tms-backend-3.tms-feedback alert
- applications tms-backend-4.tms-booking alert
- applications tms-backend-4.tms-drivers alert
- applications tms-backend-4.tms-feedback alert
- applications Tower: Attracs Online REST API
- External-AO BACKENDSRV-0 alert
- External-AO BACKENDSRV-1 alert
- External-AO Certificate expiration for cramo.attracs.com alert
- External-AO Certificate expiration for online2.attracs.com alert
- External-AO CPU load alert
- External-AO LOG-ENTRY: EXCEPTION alert
- External-AO LOG-ENTRY: EXCEPTION alert gLb6vvG4k
- External-AO LOG-ENTRY: OCLPERF alert
- External-AO LOG-ENTRY: OCLPERF alert zYxeDvM4z
- External-AO LOG-ENTRY: OPTIMISTIC LOCKING alert
- External-AO LOG-ENTRY: WARNING alert
- External-AO RDSGATEWAY - Event 4625 - Fail reason alert
- External-AO RDSGATEWAY - Firewall - Allowed TCP connections per ip (health checks excluded) alert
- External-AO Request latency alert
- General Alerting TOP6 Database size increase in 1 day (Bytes) alert
- Google Cloud Monitoring /api/v1/booking/create latency alert
- Google Cloud Monitoring backends alerts alert
- Google Cloud Monitoring backends alerts alert 2YbeDDG4k
- Google Cloud Monitoring Backup storage usage alert
- Google Cloud Monitoring blocked requests alert
- Google Cloud Monitoring Bytes used attracs-services alert
- Google Cloud Monitoring CloudSQL Errors alert
- Google Cloud Monitoring CPU utilization (ATTRACS LOGISTICS) alert
- Google Cloud Monitoring CPU utilization (ATTRACS SERVICES) alert
- Google Cloud Monitoring Database restore test results alert
- Google Cloud Monitoring GCP
- Google Cloud Monitoring GCP group
- Google Cloud Monitoring Graph for transactions in idle_in_transaction_aborted_for_hour to get an alert alert
- Google Cloud Monitoring Graph for transactions in idle_in_transaction_for_hour to get an alert alert
- Google Cloud Monitoring HTTP REQUEST WITH 200 response alert
- Google Cloud Monitoring Mem usage: attracs-core-backends-9qpt alert
- Google Cloud Monitoring Mem usage: attracs-core-backends-multi-zone-nng8 alert
- Google Cloud Monitoring Mem usage: attracs-logistics-backends-3cjz alert
- Google Cloud Monitoring Mem usage: attracs-logistics-backends-vrr1 alert
- Google Cloud Monitoring Mem usage: attracs-tms-backends-multi-zone-6ggh alert
- Google Cloud Monitoring Mem usage: attracs-tms-backends-multi-zone-ckzf alert
- Google Cloud Monitoring Oldest unacked message age, subscription:$Subscription alert
- Google Cloud Monitoring PostgreSQL Deadlocks alert
- Google Cloud Monitoring Security Updates alert
- Google Cloud Monitoring Service status (ATTRACS LOGISTICS) alert
- Google Cloud Monitoring Service status alert
- Google Cloud Monitoring Spanner CPU usage alert
- Google Cloud Monitoring Spanner storage used alert
- Google Cloud Monitoring Unacked messages (TMS-SERVER) alert
- Google Cloud Monitoring Unacked messages: tms subscriptions alert
- Google Cloud Monitoring Uptime check - certificate alert
- infra AholaAO
- infra AO Server CPU 0%
- infra Distribution daily stats alert
- infra online-api-2.attracs.com - frontend responses by HTTP code alert
- infra online-api-2.attracs.com - stable backend responses by HTTP code alert
- infra online-api.attracs.com - Current number of sessions rate per second over last elapsed second alert
- infra online-api.attracs.com - frontend responses by HTTP code alert
- infra online-api.attracs.com - stable backend responses by HTTP code alert
- infra Stable services: 5xx errors
- infra Valhalla requests alert
3. Grafana OnCall
3.0 Grafana OnCall
[
github.com
https://github.com/grafana/oncall
](https://github.com/grafana/oncall)
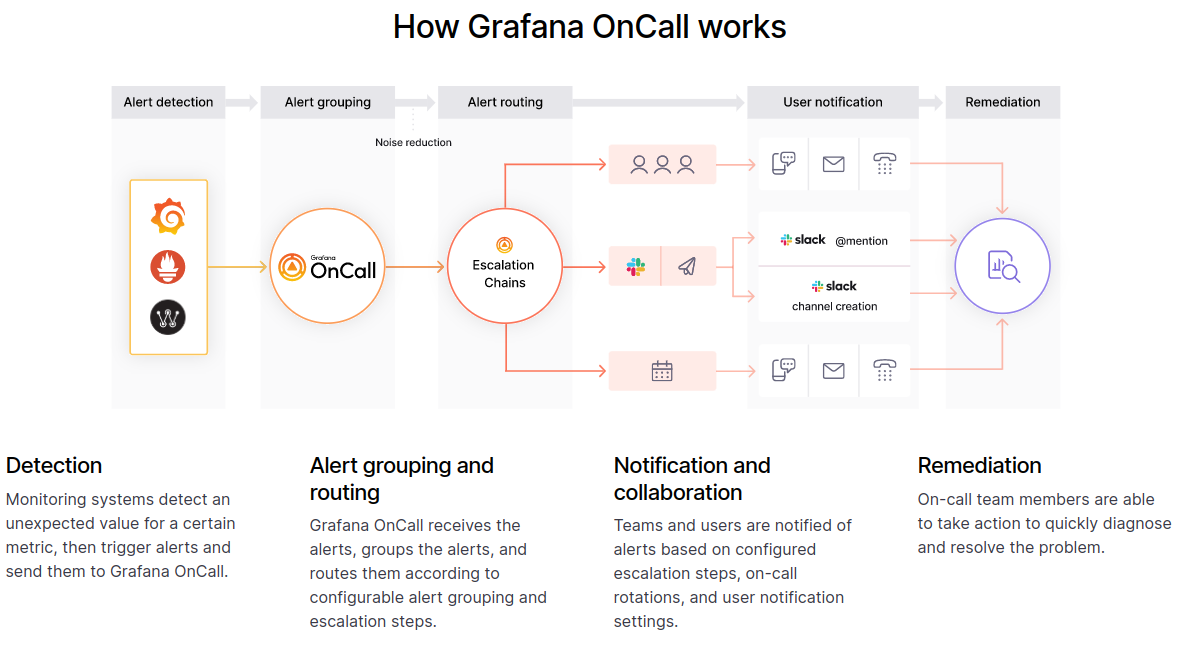
We should investigate Grafana on-call since there is need to have a better alerting system that could help us to get real alerts to them who are working, giving the best effort to take actions quickly
- We could centralize alerts to user(s) that are actually working daily, weekly with calendar integration?
- Yes, This is called on-call shift. We select users when they are on-call schedule. Also Users need to be mapped with slack user.
- We no longer have to manage separate alerts from Grafana, Prometheus, etc. Everything is integrated and works with existing alerting sources and monitoring tools
- About this we again use existing alerts, but for notification we use hook from onCall.
- Using his different groups we can select with alerts are in what group. What alerts can wait or what alerts can't.
- also we have status for the alerts
-
allows us to actually sleep well at night knowing that only the relevant notifications will reach us.
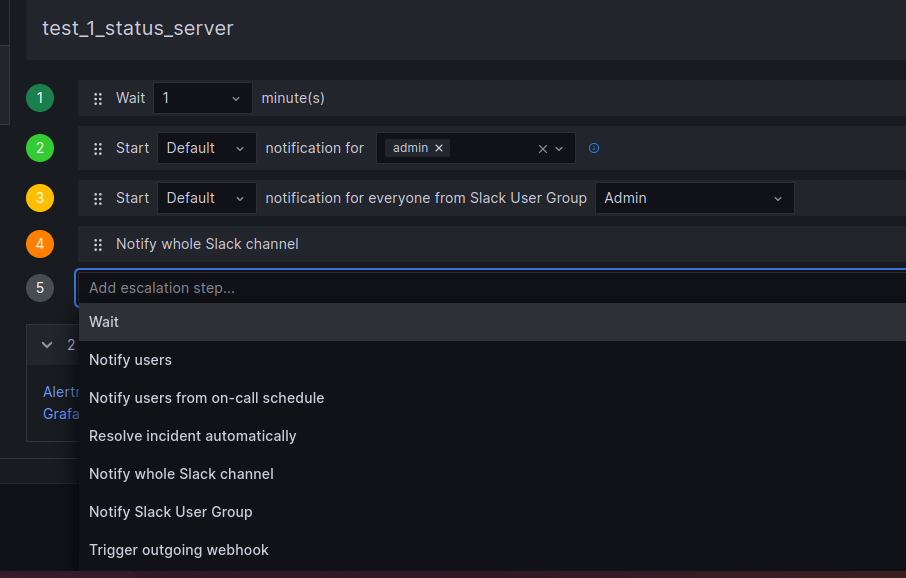
- Yes. For this we use escalation chains, when we set how notification is triggering. Like> after alert triggered > wait 5m > notifice user from on call schedule > wait >
-
What it costs (service/on our vm)
- We will need to create new backend service for grafana onCall, and in grafana site to connect.
- If we like to use some integration for SMS, Call we will need to implement some service like twilo?? but, slack and email notification and new one mobile app is okay.
- The mobile app has some configs to be always online. It would be nice to have this in summer.
[
github.com
https://github.com/grafana/oncall#getting-started
](https://github.com/grafana/oncall#getting-started)
We use onCall plugin,but why we need grafana onCall backend service and connect with the plugin?
The Grafana OnCall plugin is designed to integrate with an incident management system, which typically requires a backend server to handle the communication and orchestration between Grafana and the incident management system. reasons why a backend server is necessary for the OnCall plugin: 1. Integration with incident management systems: The backend server acts as a bridge between Grafana and the incident management system. It handles the communication and data synchronization between the two systems, allowing Grafana to fetch and display information about ongoing incidents, on-call schedules, and other relevant data. 2. Authentication and authorization: The backend server manages user authentication and authorization for the OnCall plugin. It validates user credentials, ensures proper access control, and enforces security measures. This helps protect sensitive data and ensure that only authorized individuals can view and interact with incident-related information. 3. Webhook handling: Incident management systems often use webhooks to send real-time updates about incidents to external systems. The backend server can receive these webhook notifications and process them accordingly. It can trigger alerts, update Grafana dashboards, and initiate other actions based on the incoming data. 4. Data transformation and aggregation: The backend server can perform data transformation and aggregation tasks to provide a consolidated view of incidents within Grafana. It can normalize data from different incident management systems and present it in a standardized format, making it easier for users to analyze and monitor incidents from a single interface. 5. Customization and extensibility: With a backend server, you can extend the functionality of the OnCall plugin to suit your specific needs. You can implement custom workflows, integrate with additional systems, or apply business logic specific to your organization. The backend server acts as a flexible layer that allows you to tailor the plugin's behavior to align with your incident management processes. In summary, installing a backend server for the Grafana OnCall plugin enables seamless integration with incident management systems, provides security and access control, handles real-time updates, performs data transformation, and offers customization options. It enhances the functionality and usability of the plugin within the Grafana environment.
3.1 How to install
Grafana It's hosted on our DevOps.1 server which is in ahola on prem currently
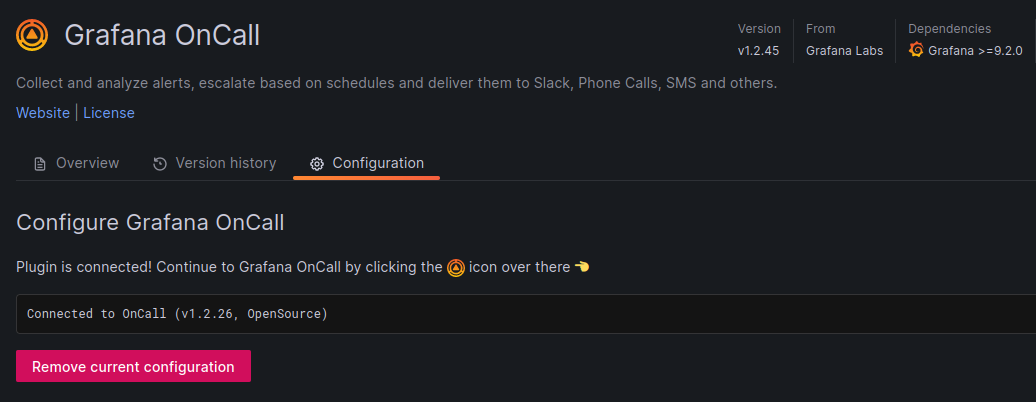
For installing onCall we need: 1. 1. To instal OnCall engine this is backend for grafana. 2. And OnCal plugin installed on Grafana web configuration page. 3. and OnCall plugin to be connected with backend engine localhost:8080. This task will be easy, on our docker file we add: onCall docker extension sets. and on our grafana to install new plugin onCall. also in our grafana docker-compose file to add this environments environment: GF_PLUGINS_ALLOW_LOADING_UNSIGNED_PLUGINS: grafana-oncall-app GF_INSTALL_PLUGINS: grafana-oncall-app
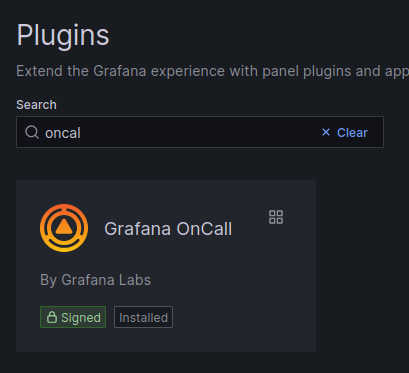
In grafana plugins find:
3.2 Contend
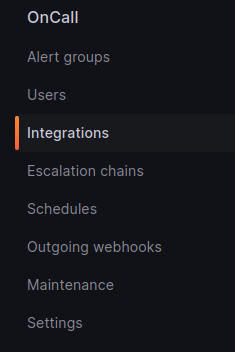 onCall:
* * Alert groups
onCall:
* * Alert groups
\-In section Alert groups we can see all triggered alerts and their status with history of the escalation.
-
-
Users
-here we can see created users in grafana. In this section we can see user configs for default or important notification. This is when in escalation chains we choose: "Start Default or Important notification for users:_____"
-
-
-
Integration
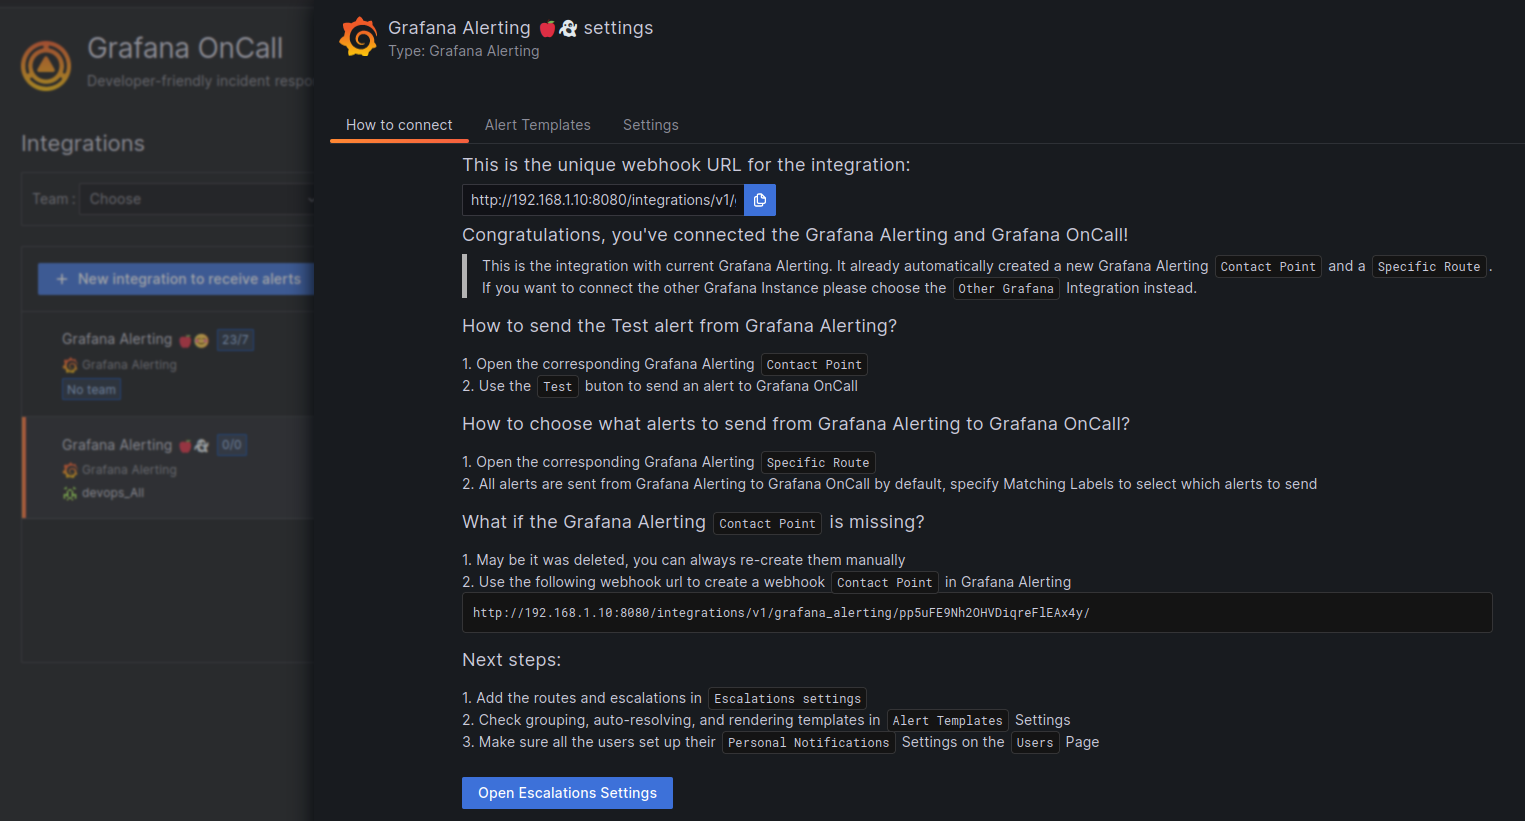
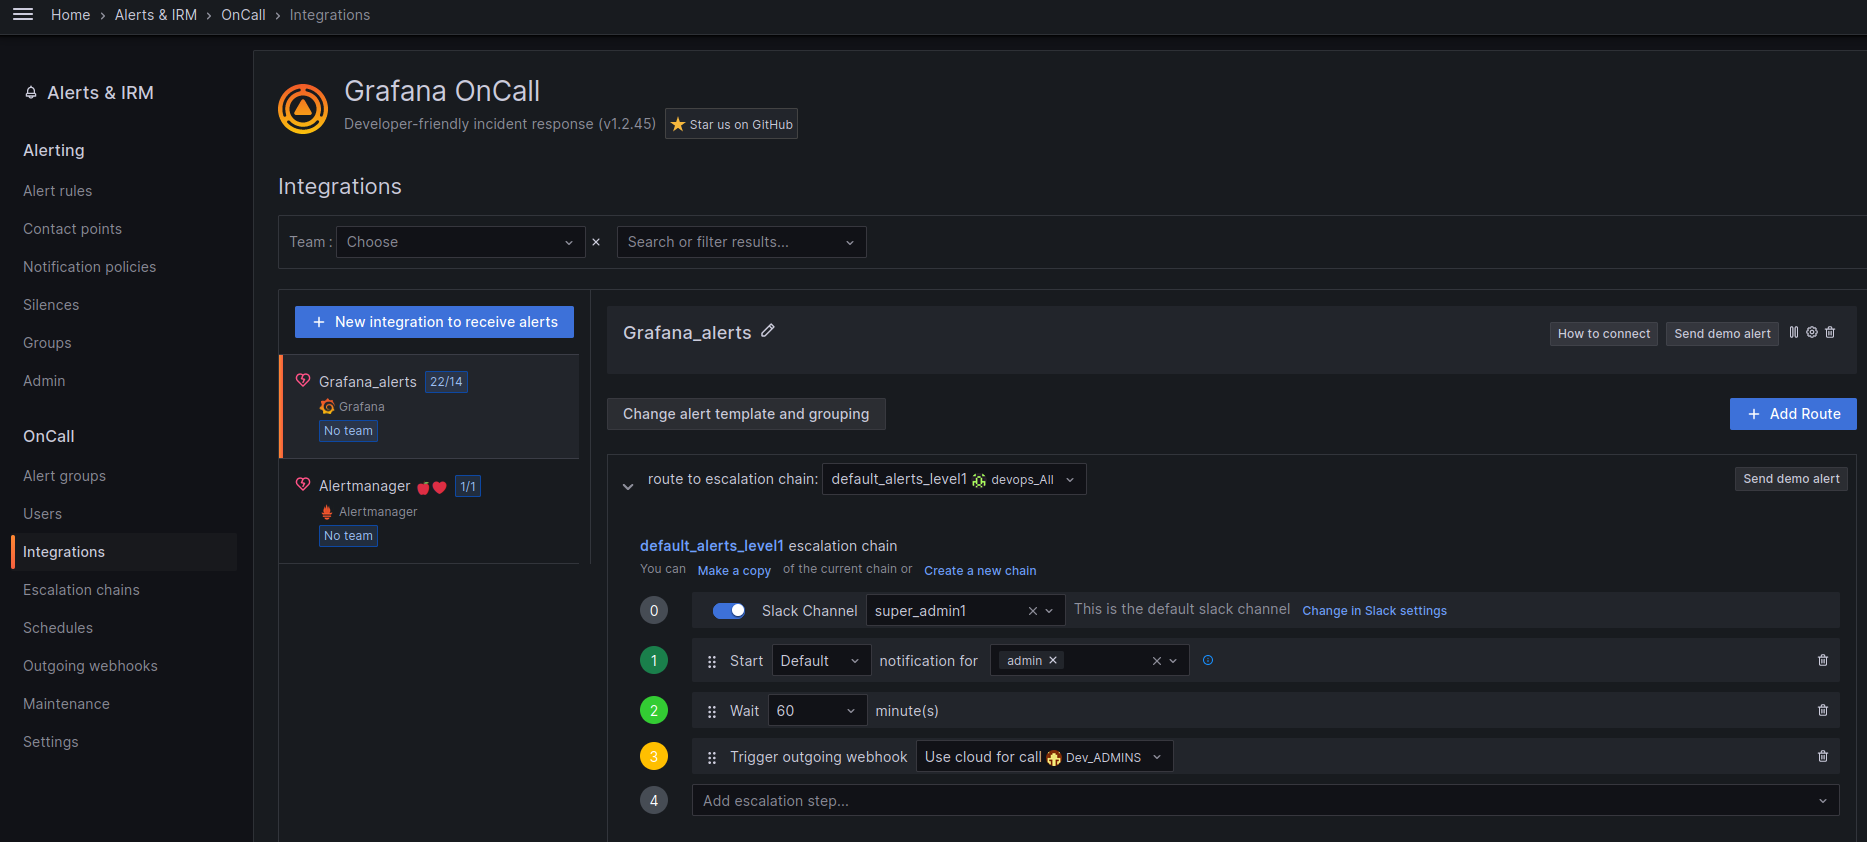
in this scope we can create Integrations
- This integrations are webhooks. We can create different webhooks for specific type of alerts. This integrations are paired with escalation chains.
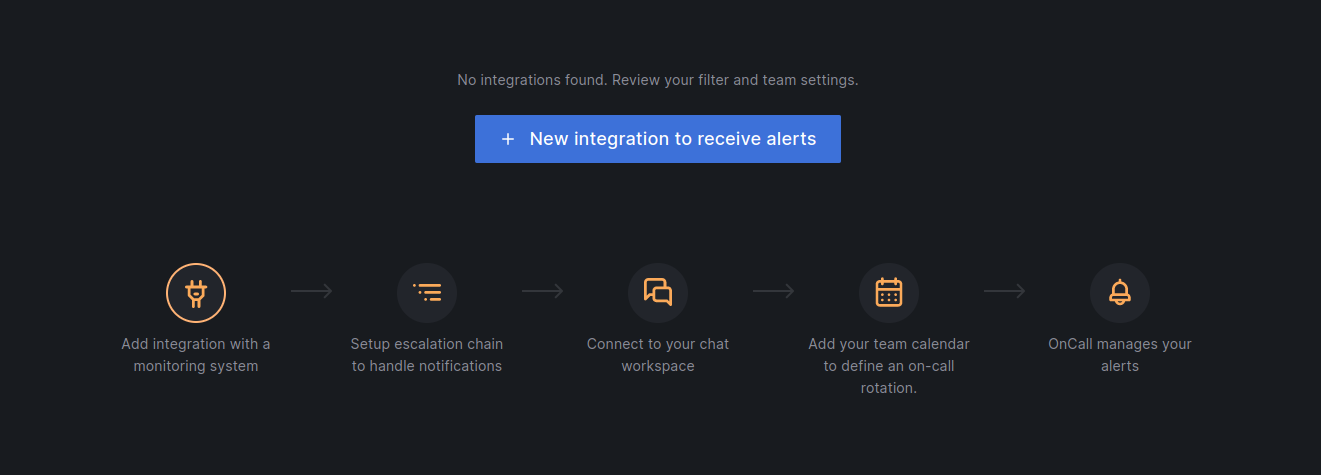
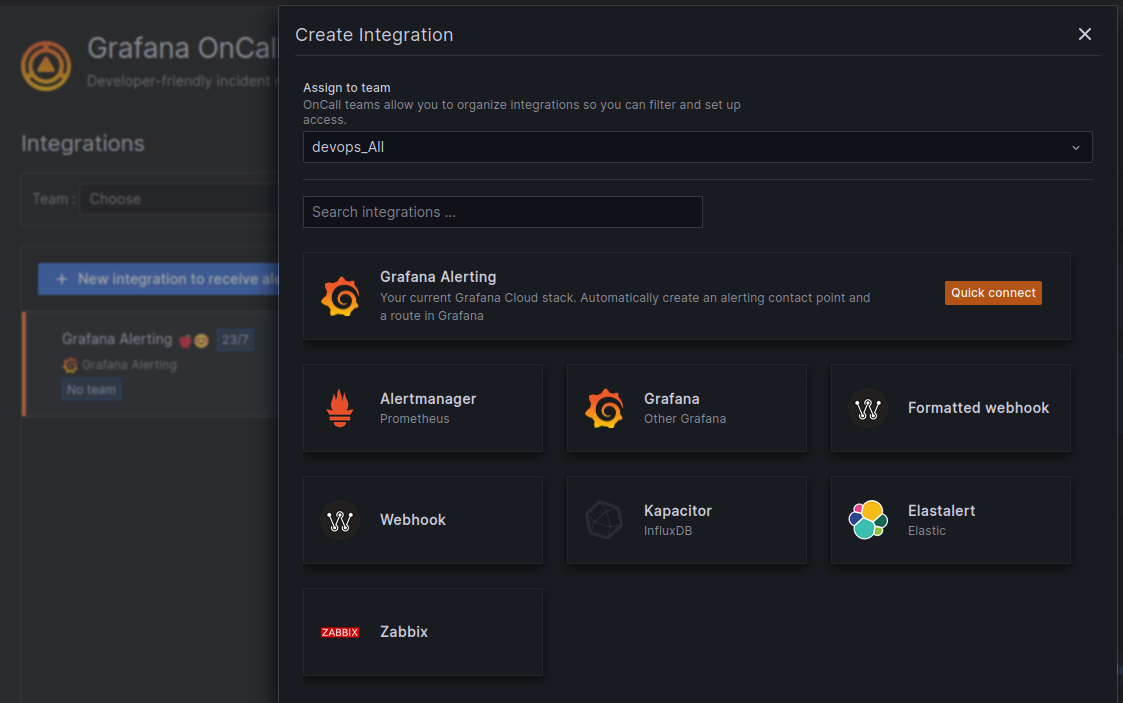 by default we go with Grafana Alerting
- This integrations are webhooks. We can create different webhooks for specific type of alerts. This integrations are paired with escalation chains.
-
-
-
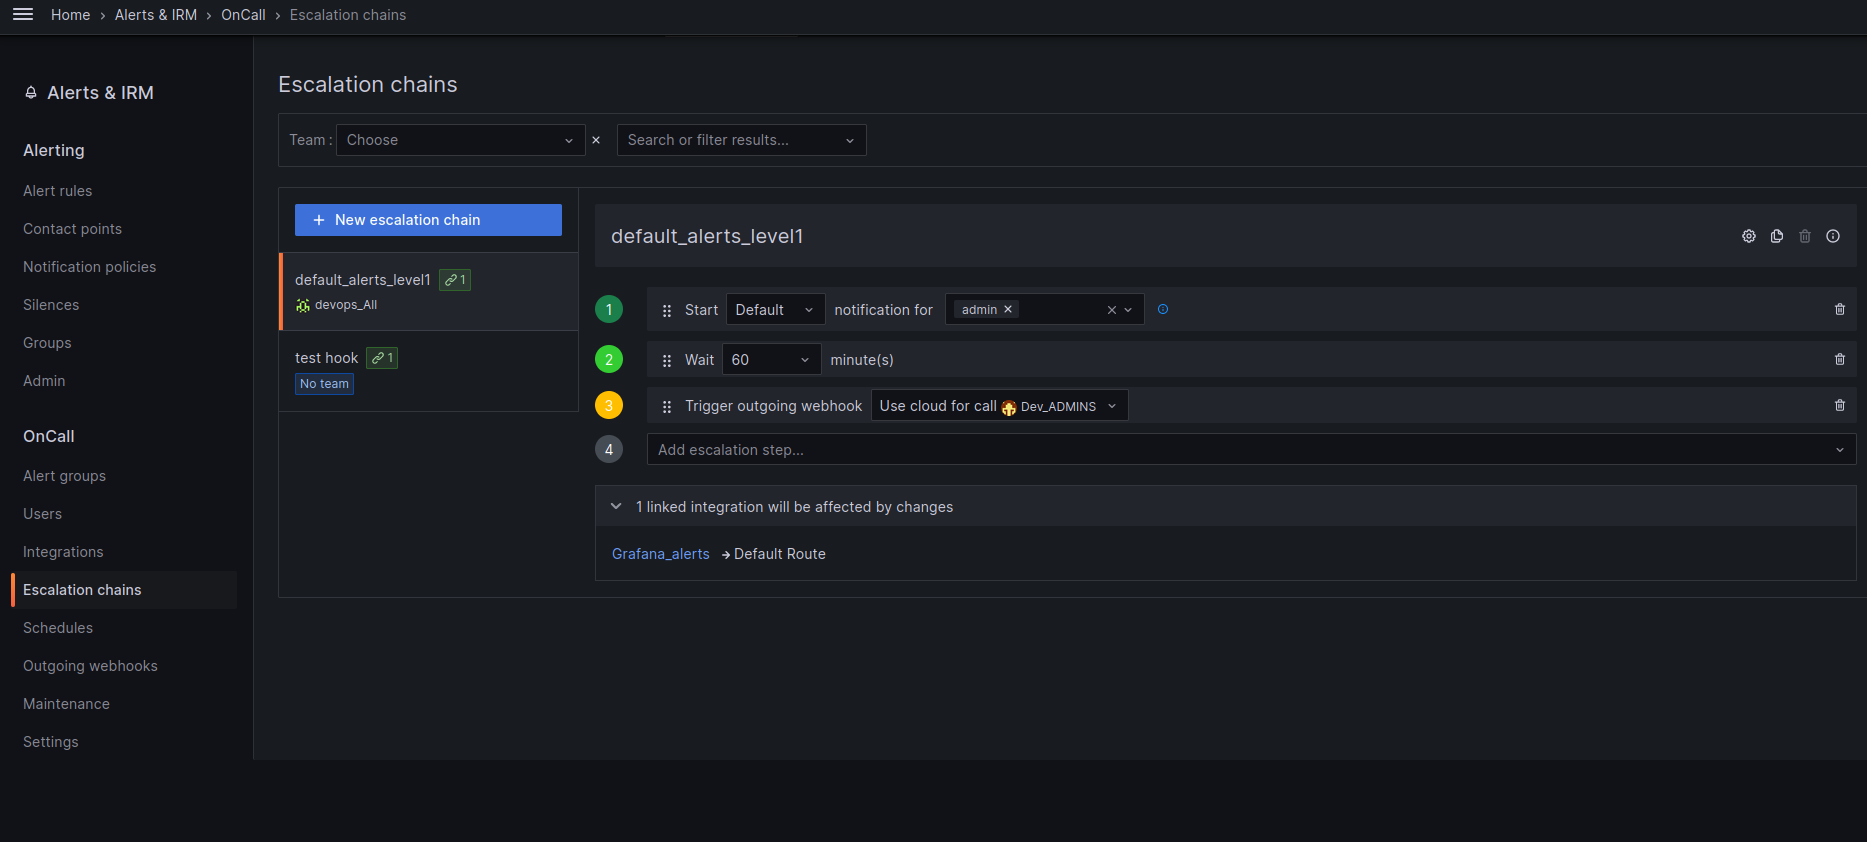
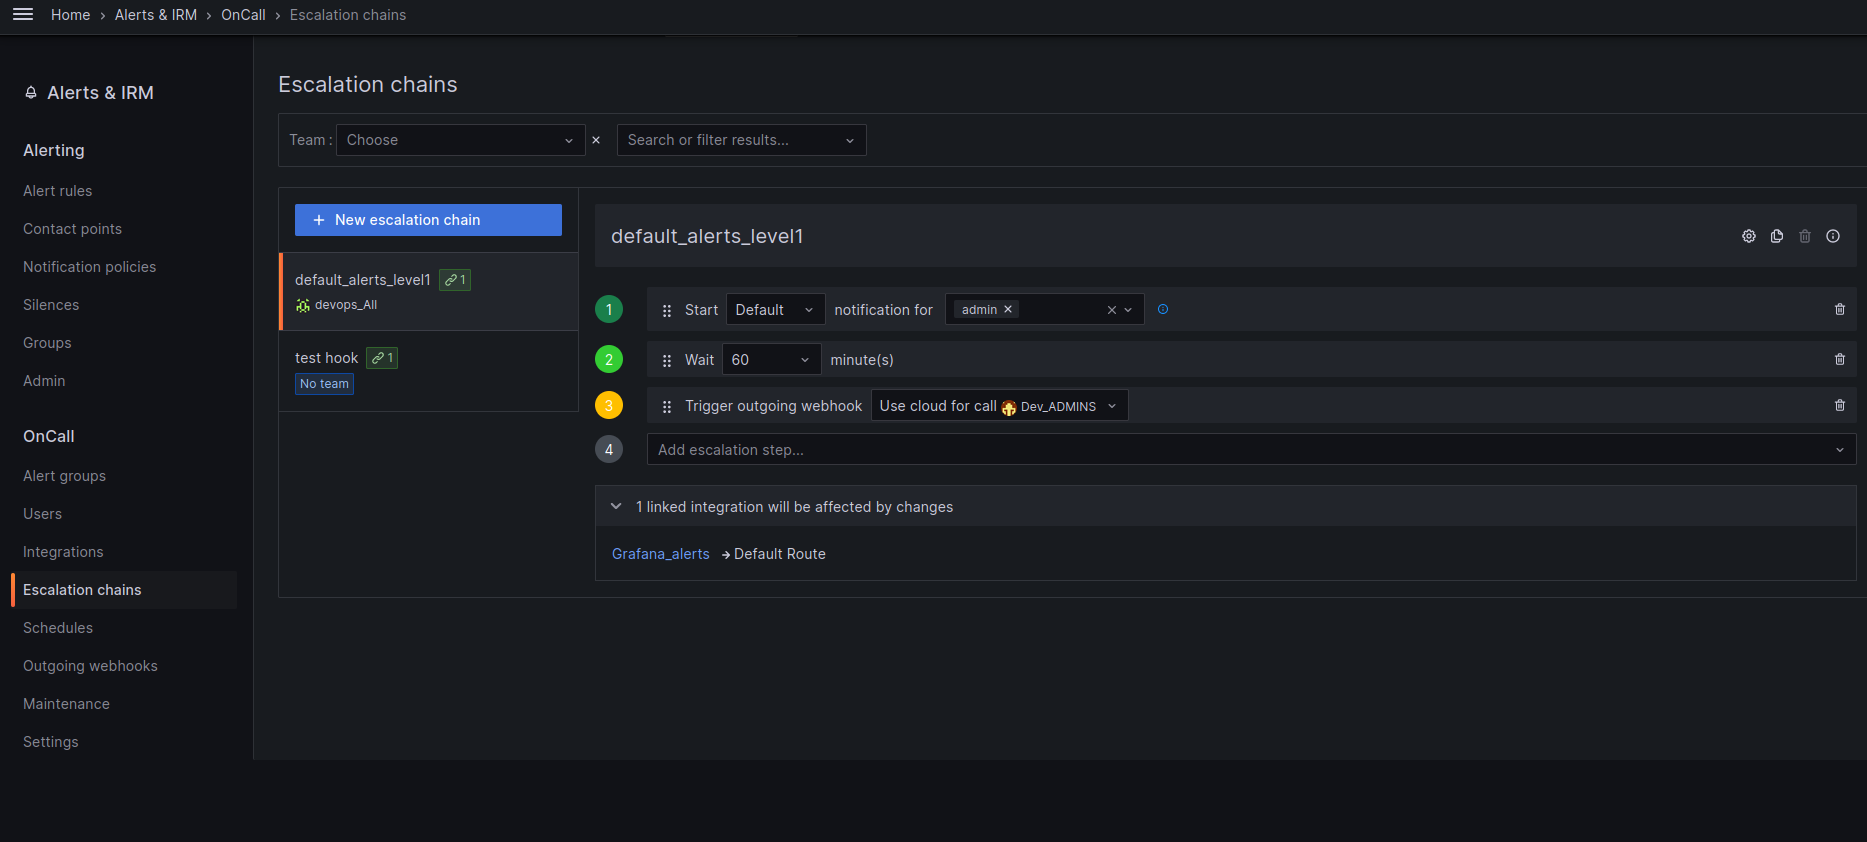
Escalation chains
Here we can see\create escalation chain.
-
-
-
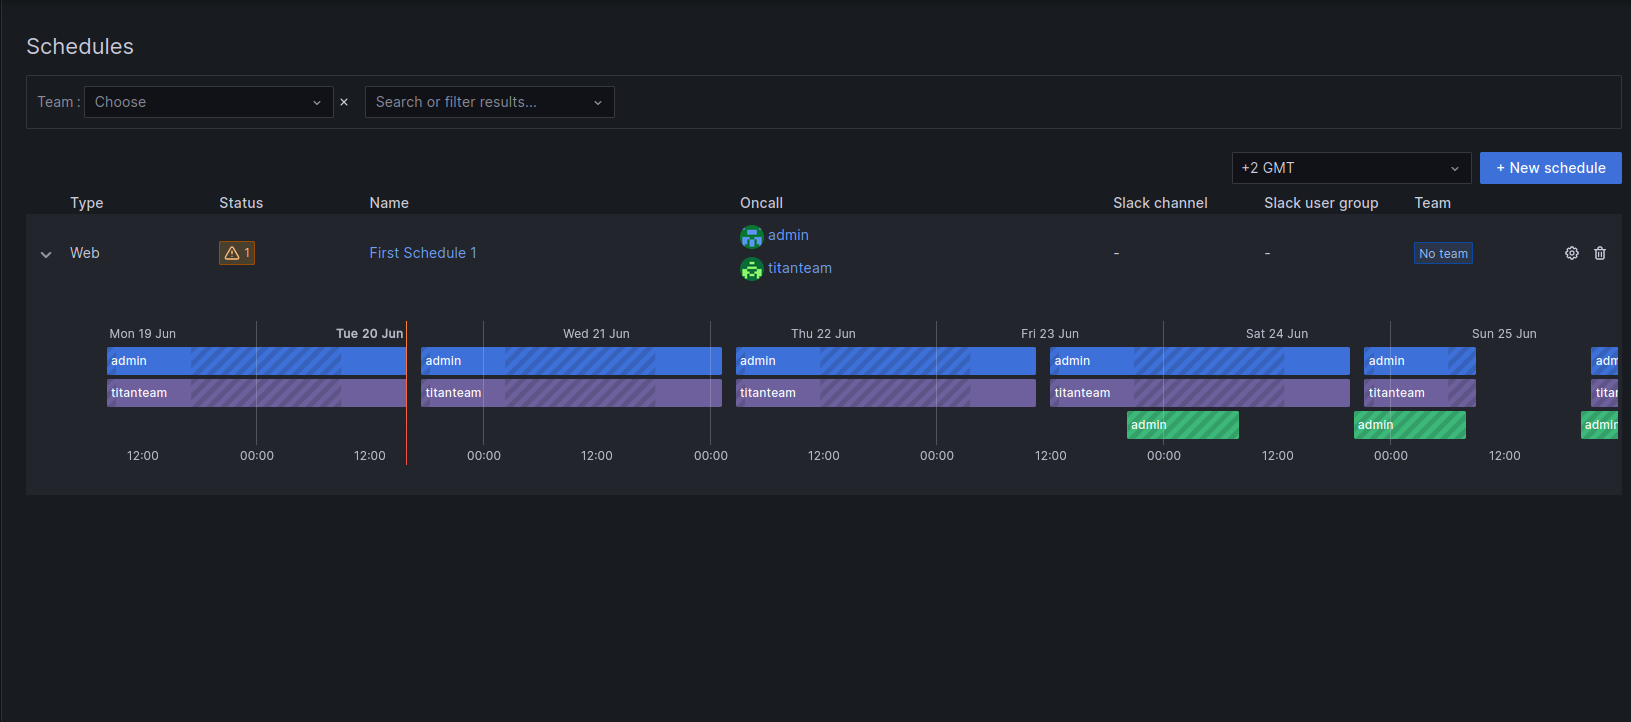
Schedules
This section is for creating calendar with shifts.
-
-
-
Outgoing webhooks
- Outgoing webhooks allow you to send alert details to a specified URL from Grafana OnCall. Once an outgoing webhook is configured, you can use it as a notification method.
- For this example we can check Grafana: 3.3 Grafana OnCall: How to make integration local and cloud grafana notifications. (https://app.clickup.com/2496230/docs/2c5q6-9906/2c5q6-213541) using outgoing webhooks.
-
-
-
Maintenance
-When we have problem wee can mute noisy sources or use for debugging and avoid bothering us.
-
-
-
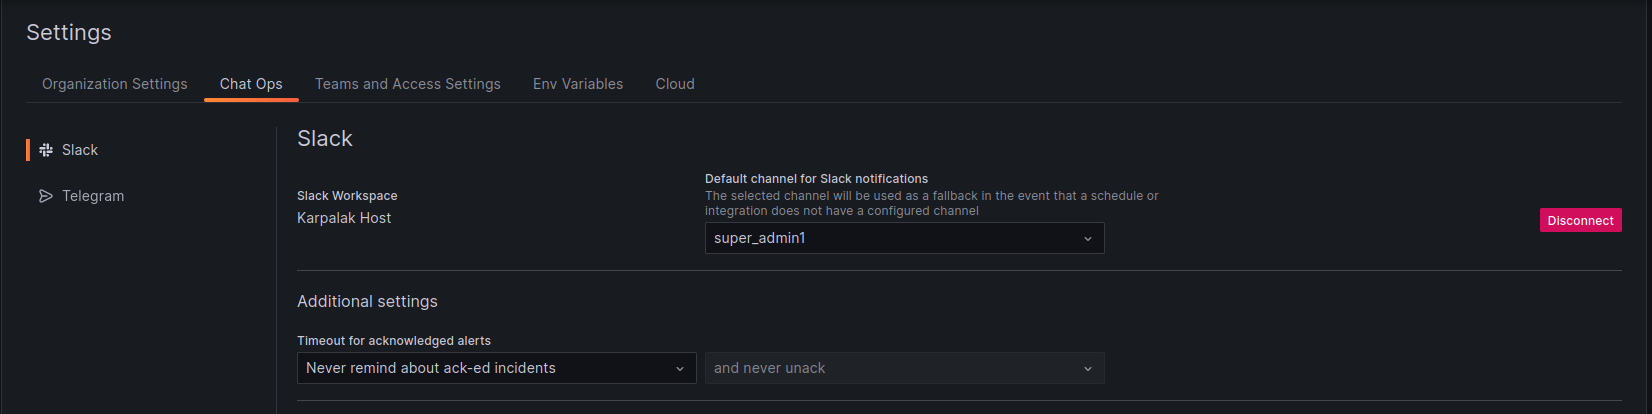
Settings
-
3.3 How to make integration local and cloud grafana notifications
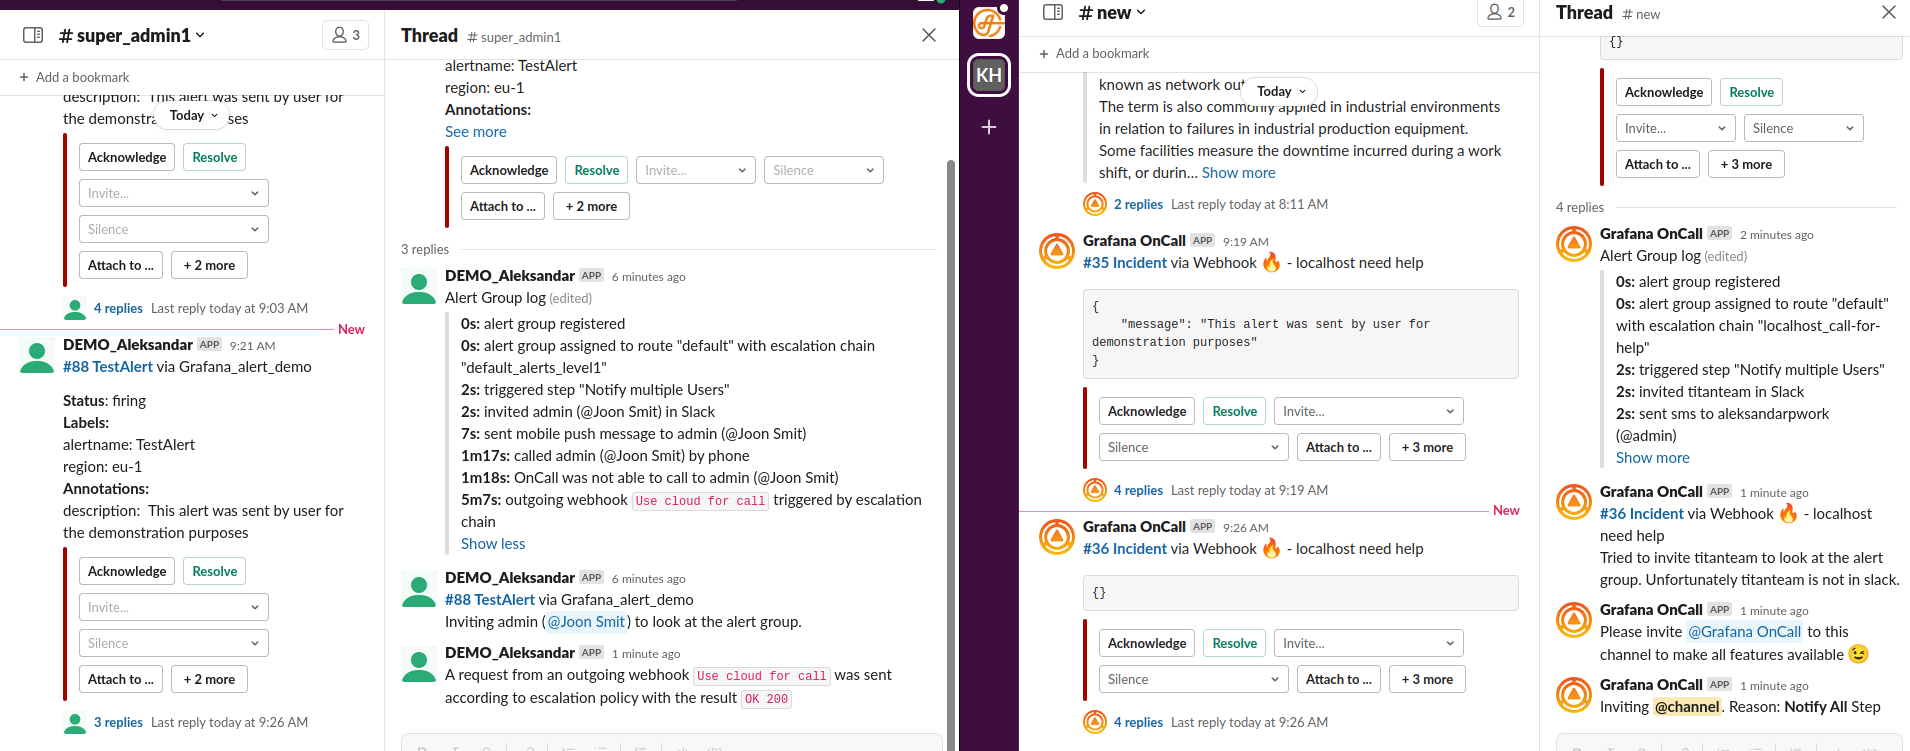
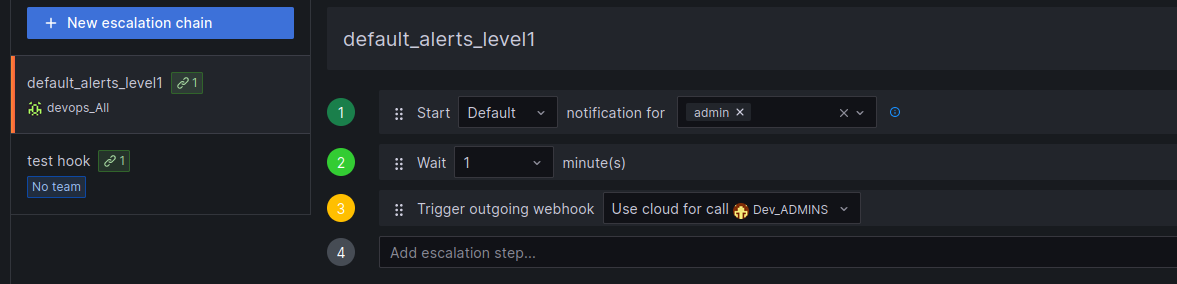
on my local env I created escalation chain where on the end I'm triggering webhook.
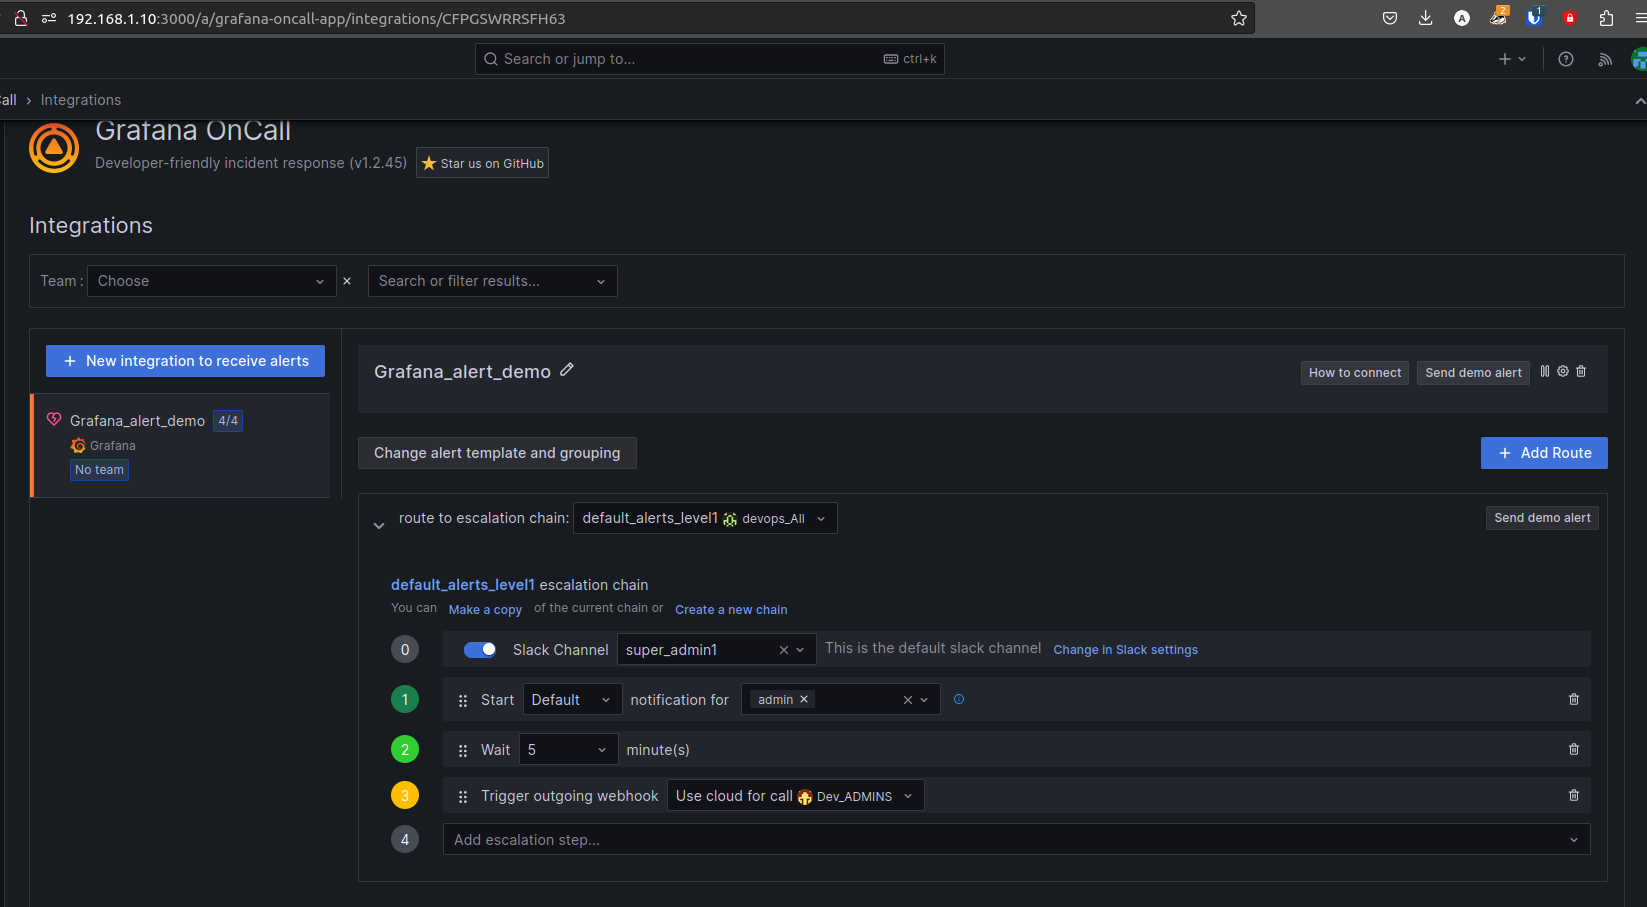
This webhook will be used for Calling the user. This webhook is created on free cloud grafana. Free plan on cloud can provide only 3 users. On my cloud grafana I created new Integration "Webhook" with escalation chain where I'm sending notification to the users.
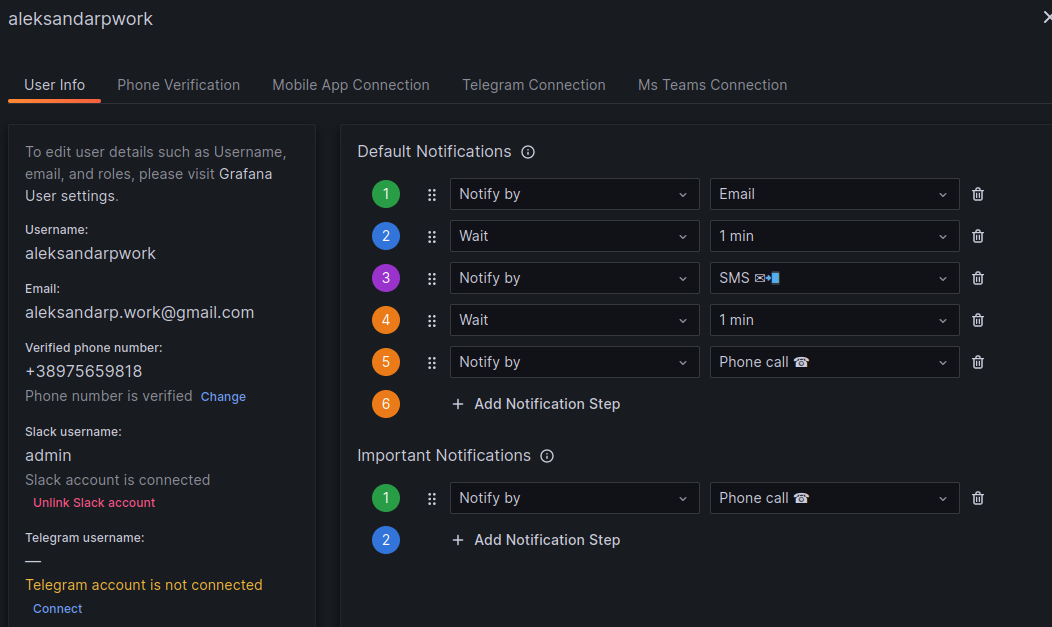
because Escalation chain notification and Users notifications is different in my user configuration I set to be receive SMS and after 1 min to get call.
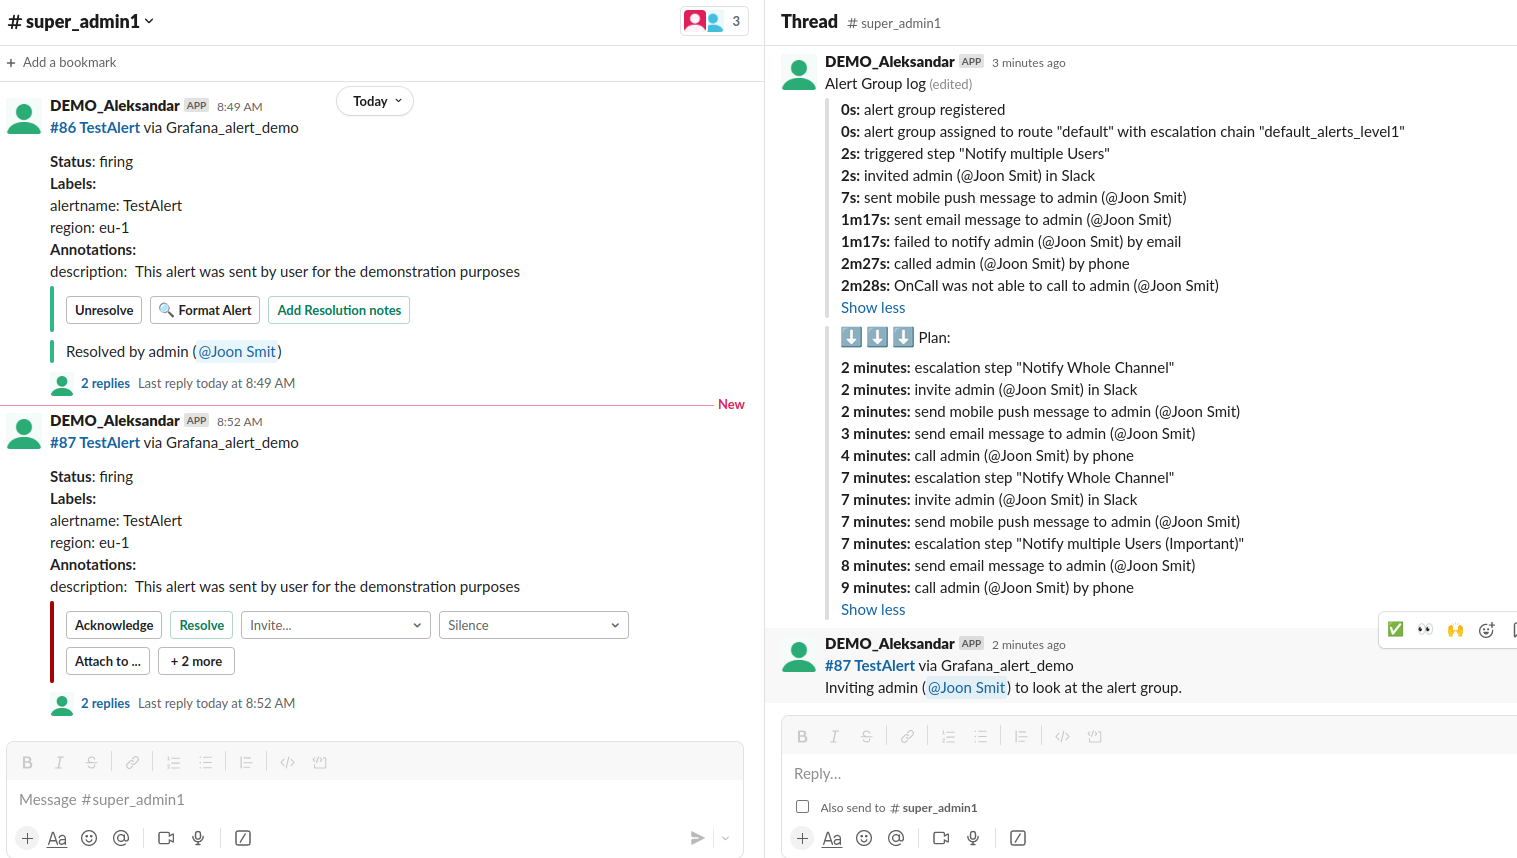
Simple demo of one escalation chain. 1. Alert is firing!!! 2. The configuration in Alerts & IRM we have set up webhook. where we will activate our escalation chain for notification.
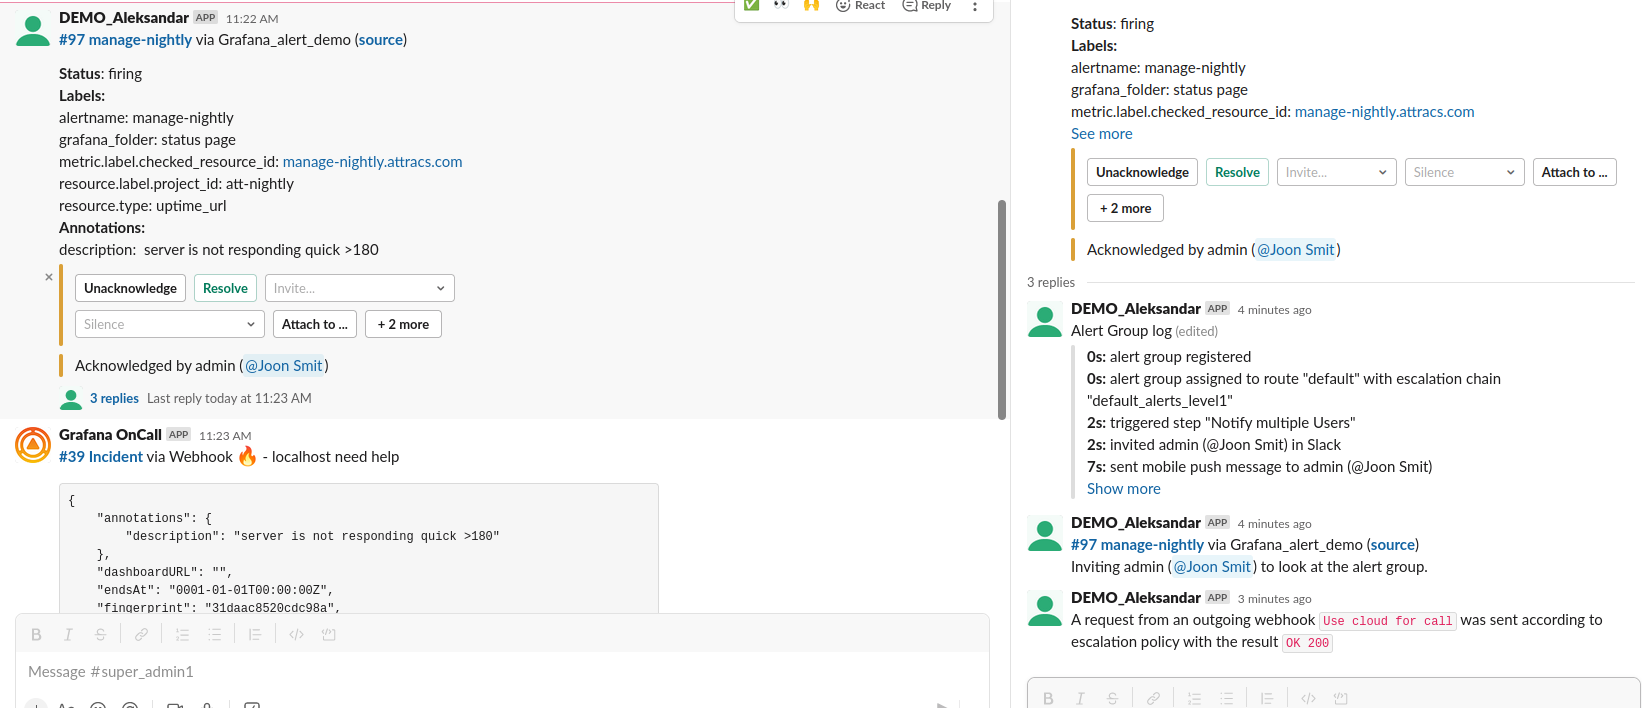 Webhook is triggered and start the escalation.
First post the alert in our chanel. and i tread is writhing the steps that will go.
Start with Default notification for user admin.
-This mean is triggering notifications for user admin.
Webhook is triggered and start the escalation.
First post the alert in our chanel. and i tread is writhing the steps that will go.
Start with Default notification for user admin.
-This mean is triggering notifications for user admin.
Every user can create his own way of notification chain. There is 2 types Default and Important.
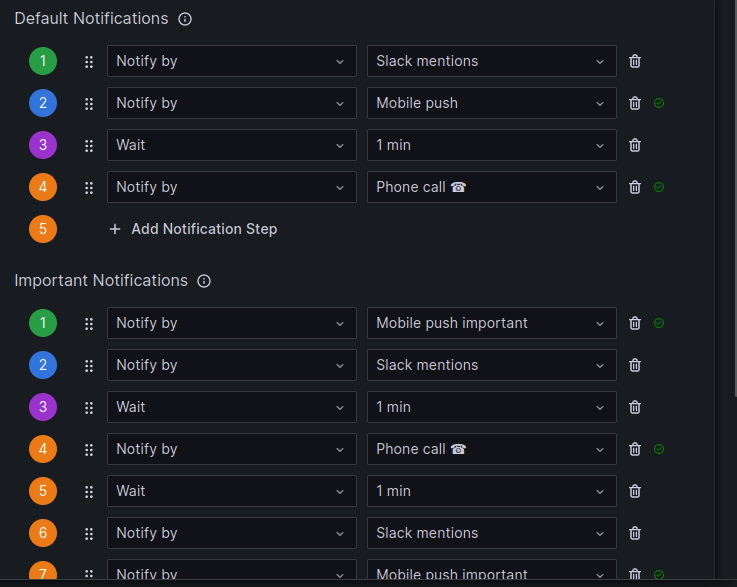 and after that escalation is continuing...
where we are triggering our webhook from cloudGrafana.
and after that escalation is continuing...
where we are triggering our webhook from cloudGrafana.
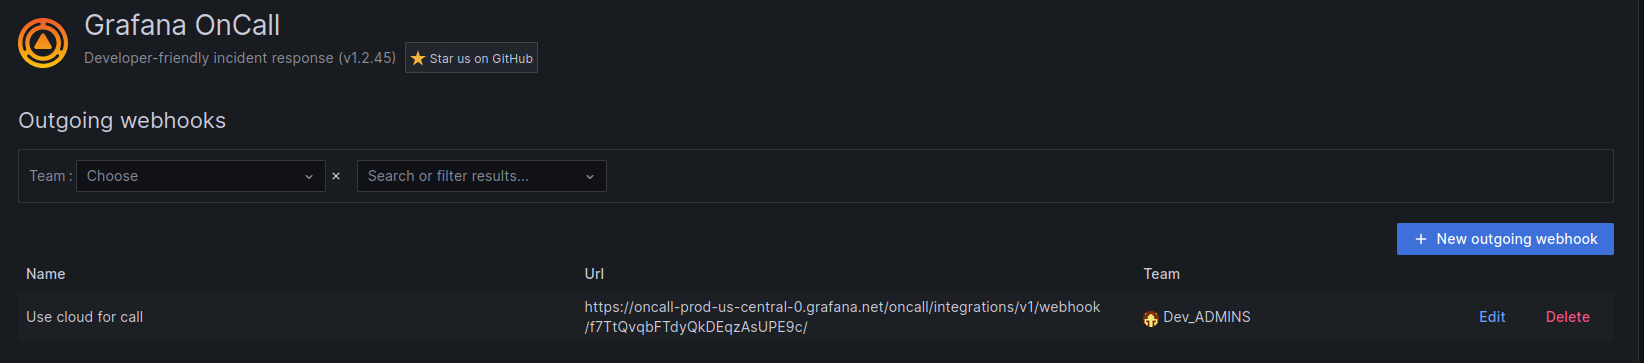 For final result gloud grafana will call us, sms, email... (I don't find limitations for using onCall notifications. Only that free plan can support 3 users.)
For this we need to have 2 apps integrated one from our grafana and second from cloud grafana.
For final result gloud grafana will call us, sms, email... (I don't find limitations for using onCall notifications. Only that free plan can support 3 users.)
For this we need to have 2 apps integrated one from our grafana and second from cloud grafana.
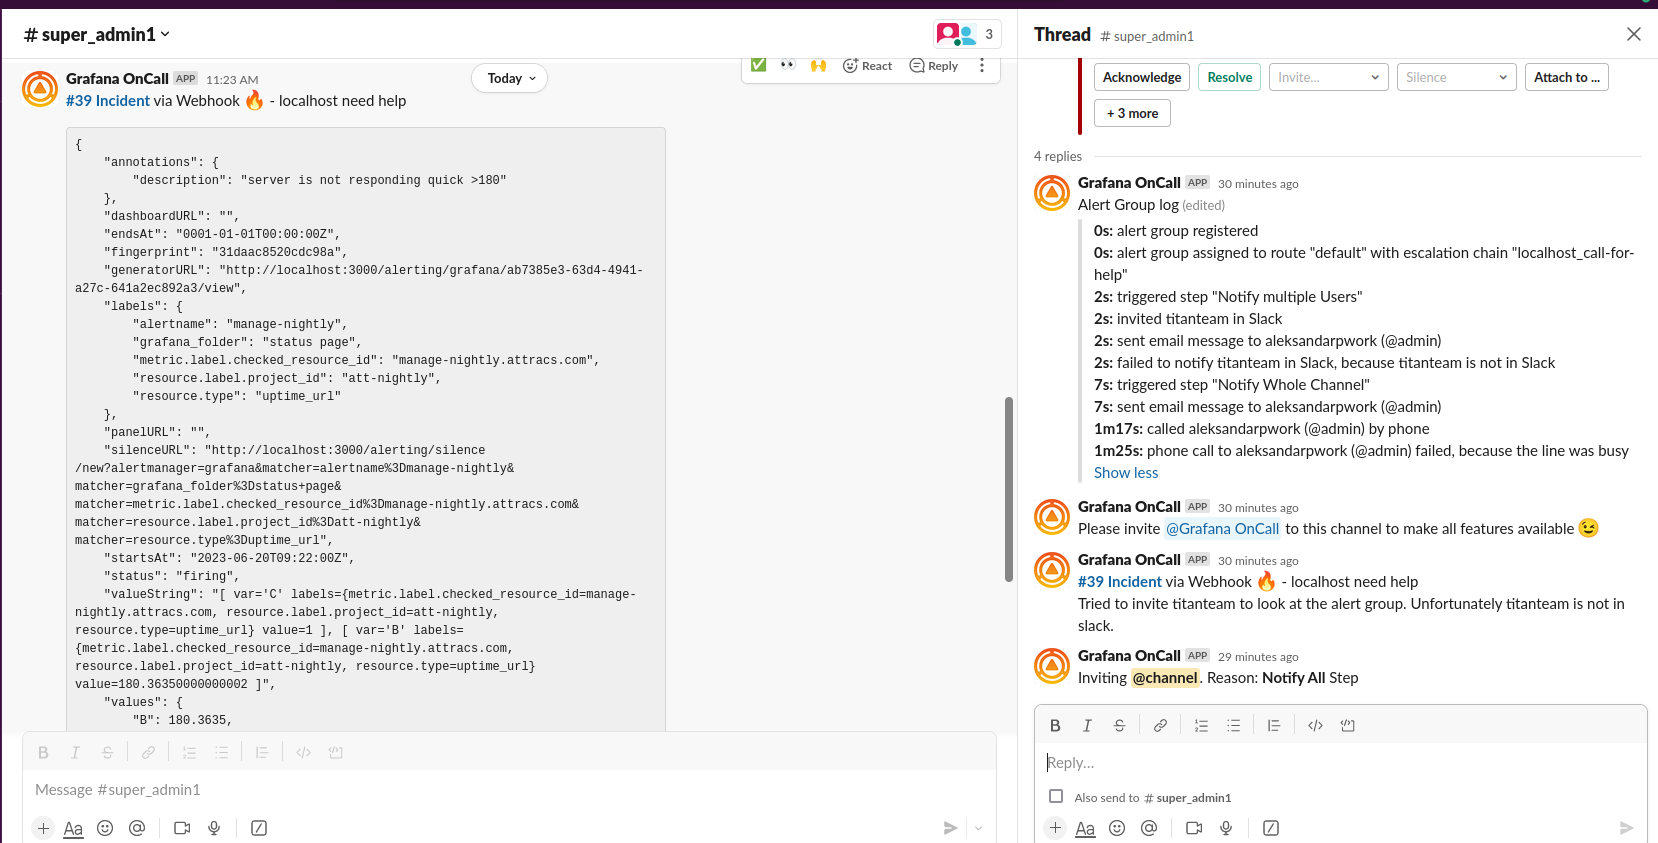
3.4 Escalation Chain plan
3.4.0 Escalation Chain plan
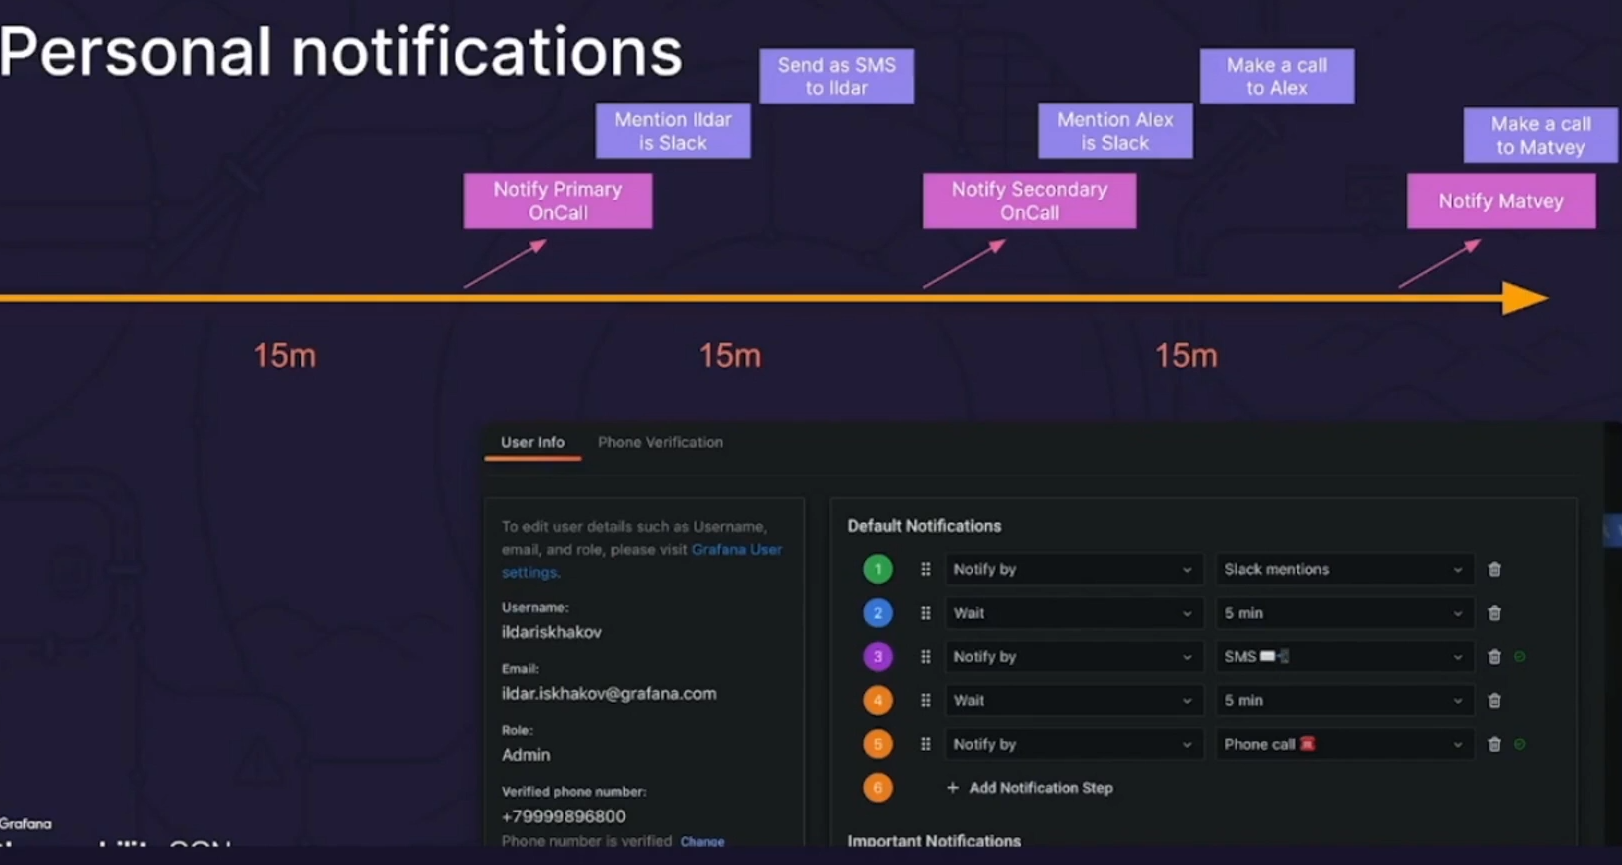
I will create proper diagram for this algorithm diagram.
| alarm | |||
|---|---|---|---|
| no need immediate action, most of the time is resolve by them self | we can check tomorrow morning | prepare to response for the alarm | |
| firing | firing | firing | |
| slack notification | slack notification | slack notification | |
| #alert_0level | #alert_1level | #alert_devOps | |
| wait 15min | |||
| Default notification onCall users. | |||
| Default notification ➝: | |||
| send slack and mobile App notification | |||
| wait 15. | |||
| / | if resolved =ok else continue with email send |
||
| wait 5 | |||
| if achnologic or resolve = ok else continue with Next user. |
3.4.1 Alerts prior
Nothing here yet
4. Public dashboards
The idea is we to create dashboard with Green / Red panels for our servers.
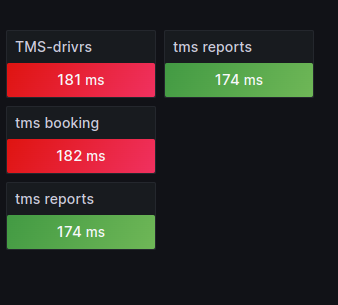 This example using Monitoring metric with Request latency.
IF request latency is high like more than 10sec something is happening with this server so results will be hard availability response, or the server is down.
This example using Monitoring metric with Request latency.
IF request latency is high like more than 10sec something is happening with this server so results will be hard availability response, or the server is down.
How to make dashboard public?
This is most easy step. In our docker of grafana ini file we need to add> GF_FEATURE_TOGGLES_ENABLE: publicDashboards
after restart we go to selected panel and in share menu we allow sharing to public.
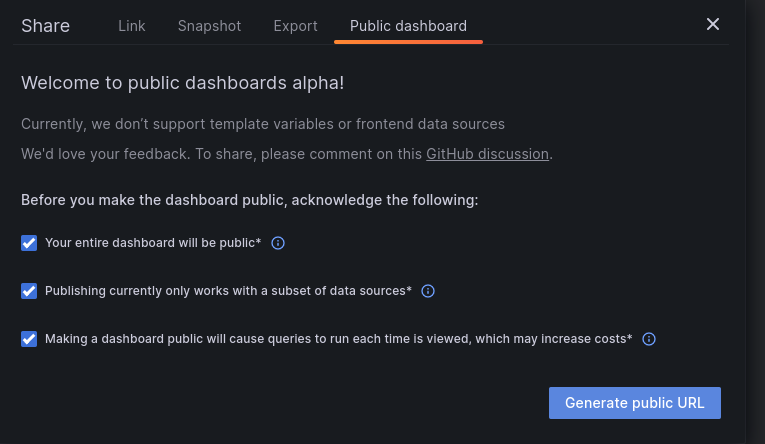
Public dashboard * Every time we access the dashboard we make execution of queries * Depends the access * Here the problem will be more about GCP api access. If we use some metrics from GCP we make api access, so google will count every api access, the pay rate is little but if is happening some ddos this is no good. * but We run on permisess, so we will don't have much to worry about rapidly query execution.
some cautions limitations listed in grafana site:
Caution: Making your dashboard public could result in a large number of queries to the datasources used by our dashboard.
This can be mitigated by utilizing the enterprise caching and/or rate limiting features.
Limitations
- Panels that use frontend datasources will fail to fetch data.
- Template variables are currently not supported, but are planned to be in the future.
- Exemplars will be omitted from the panel.
- Only annotations that query the
-- Grafana --datasource are supported. - Organization annotations are not supported.
- Library panels are currently not supported, but are planned to be in the future.
- Datasources using Reverse Proxy functionality are not supported.
What is Caching? Cached Queries are a way for you to build applications with charts and tables that load instantly. A common use case for caching is to prepare and pre-compute query results that are going to be embedded into live customer-facing dashboards.
Query caching
When query caching is enabled, Grafana temporarily stores the results of data source queries. When you or another user submit the exact same query again, the results will come back from the cache instead of from the data source (like Splunk or ServiceNow) itself. Note: Storing cached queries in-memory can increase Grafana’s memory footprint. In production environments, a Redis or Memcached backend is highly recommended.
Query caching benefits
- Faster dashboard load times, especially for popular dashboards.
- Reduced API costs.
- Reduced likelihood that APIs will rate-limit or throttle requests. Note: Available in Grafana Enterprise and Grafana Cloud Pro and Advanced
We can create our Query caching, where we will fetch the data from the dashboards and we will store to our db and show that. and display on our website.
5. Blackbox exporter
- You need to clone the following repo:
[
github.com
https://github.com/prometheus/blackbox_exporter
](https://github.com/prometheus/blackbox_exporter)
Than you need to edit in blackbox.yml file the following code:
modules:
  http_2xx:
    prober: http
    timeout: 5s
    http:
      valid_http_versions: ["HTTP/1.1", "HTTP/2.0"]
      valid_status_codes: []  # Defaults to 2xx
      method: GET
- Than we create docker-compose file in the folder that we cloned the repo with the following code:
version: '3.2'
services:
  blackbox:
    image: prom/blackbox-exporter:latest
    ports:
    - 9115:9115
    command:
    - --config.file=/etc/blackbox/blackbox.yml
    volumes:
    - ./config/blackbox.yml:/etc/blackbox/blackbox.yml
- Then you make docker-compose up -d and you have blackbox exported docker created on port 9115.
- After that in the Prometheus configuration you need to add this code:
- job_name: blackbox
  metrics_path: /probe
  params:
    module: [http_2xx]
  static_configs:
   - targets:
      - https://(aholadigital.com)/.      # This is example adress you need to change
  relabel_configs:
   - source_labels: [__address__]
     target_label: __param_target
   - source_labels: [__param_target]
     target_label: instance
   - target_label: __address__
     replacement: localhost:9115   # Here you need to add the IP adress from Blackbox exporter
After that you go to Grafana ➝ Dashboard ➝ Import dashboard and you are importing the following dashboard:
[
grafana.com
https://grafana.com/grafana/dashboards/7587
](https://grafana.com/grafana/dashboards/7587)
1.