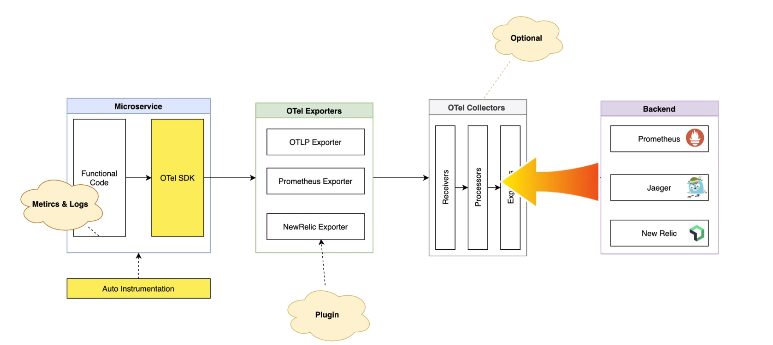
Grafana Faro
Grafana Faro docker are running at hetzner-backend3. and From Grafana we are connecting Loki, Tempo and Mimir (at place for Prometheus).
[
github.com
https://github.com/grafana/faro-web-sdk/blob/main/README.md
](https://github.com/grafana/faro-web-sdk/blob/main/README.md)
Grafana-Faro experiments
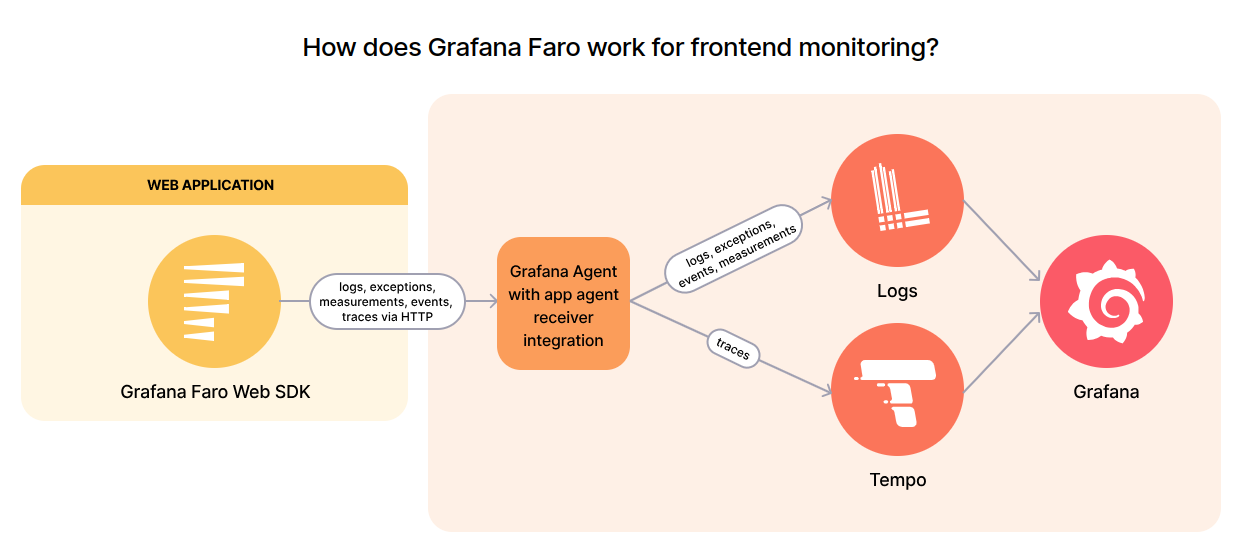
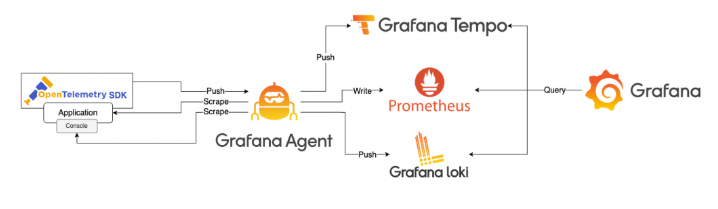
- We have Grafana Faro with Faro Web SDK installed
- For every actions inside web-app, Web SDK send post requests to the Grafana Agent.
- looking in this setup Grafana Agent didn't need to be together with Web SDK.
- Grafana Agent sends logs to Loki.
- Tempo is using Loki and agent logs for further creating Grafana dashboards.
On grafana site we need to have: 1. 1. Grafana 2. Tempo 3. Loki 4. prometheus 5. agent* *Agent need to have ip where will receive logs from the Application, and this Grafana Agent will send this logs to Loki and Tempo.
Data sent by the browser
The libraries from the Web SDK collect technical details about the browser interaction. The goal is not to track users, but to collect all sorts of technical data to see if there are problems with the web pages and what the perceived performance is for the users. For a website with only static pages, performance is mainly determined by the speed at which the web server delivers the files. But for more dynamic pages, it is very helpful to have more insight.
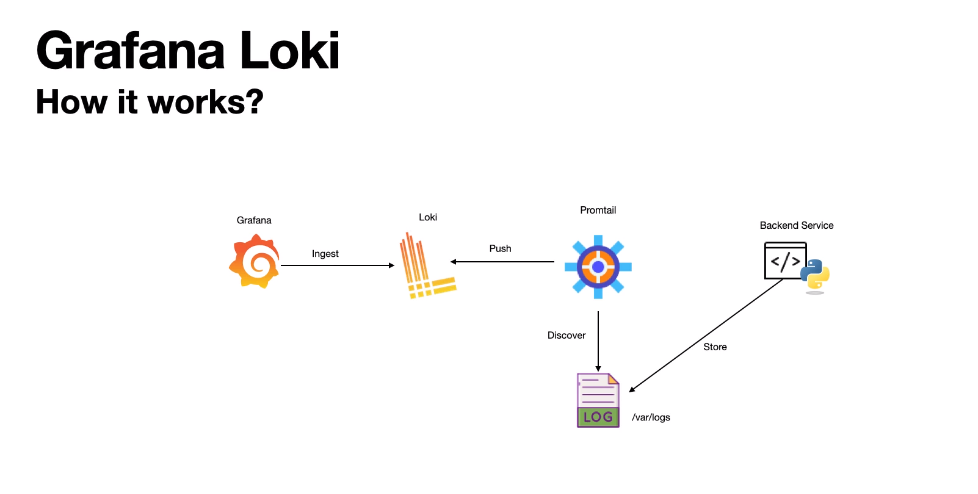 or direcly to the Loki
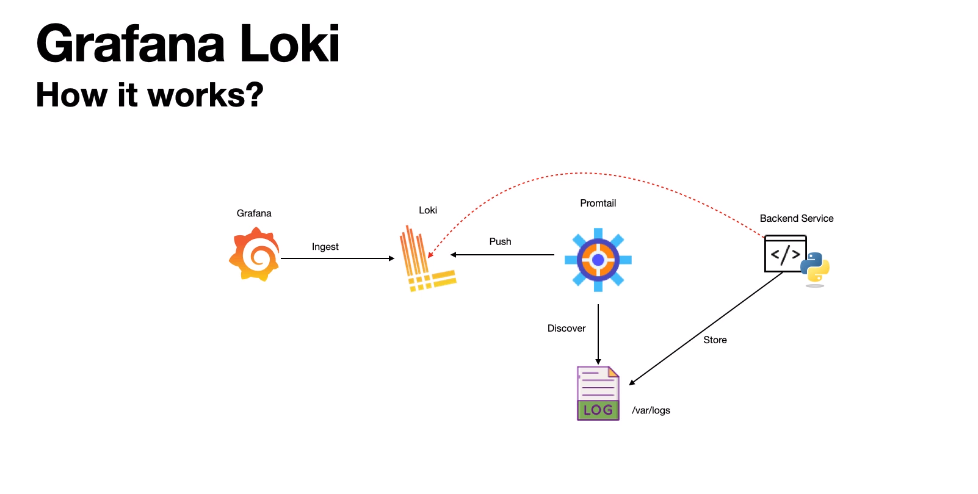
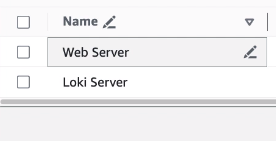
we must have PromTaill on web server. to get logs from there.
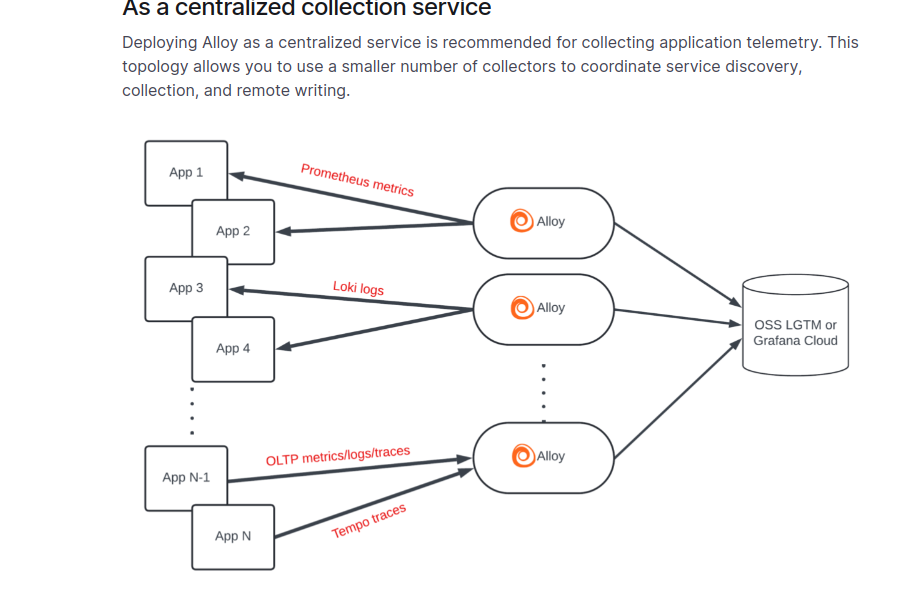
This solution need to be build from Right to Left
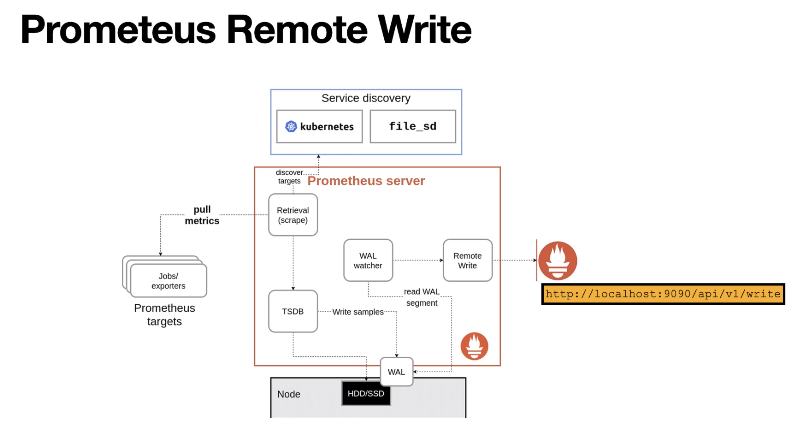 Open Telemetric is push system.